What do we do if we are given a differential equation we cannot solve algebraically?

Jenn, Founder Calcworkshop®, 15+ Years Experience (Licensed & Certified Teacher)
Well, we look at its graph and see how it behaves, and in doing so we are able to approximate a solution by analyzing the ODE qualitatively.
There are countless differential equations for which we are unable to solve algebraically, and therefore, we construct slope fields, or direction fields, as a way to analyze a function by looking at the graph of its slope.
Creating Direction Fields for ODEs
So, how do we go about creating a direction field?
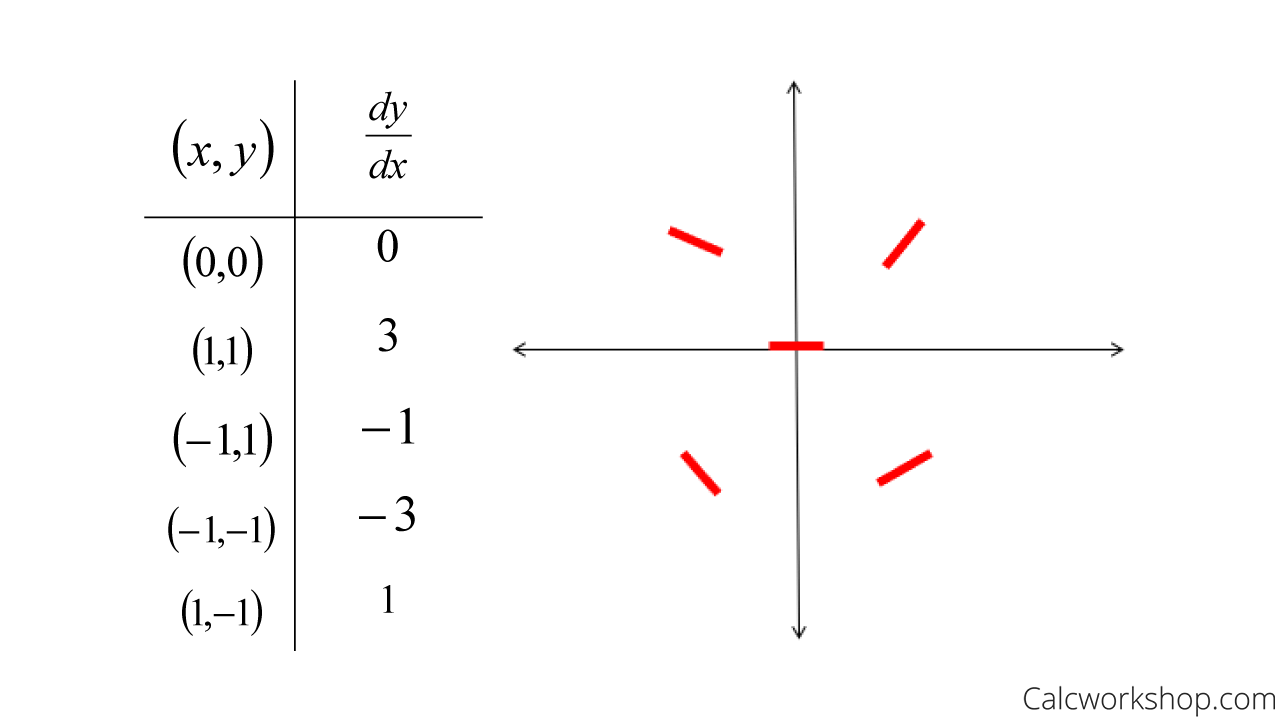
Well, if we evaluate a differential equation at various points \((x, y)\) in the xy-plane, and draw draw short line segments at each of these points with the slope \(F(x, y)\), then the collection of all of these line segments creates a direction field, or slope field, and gives us the appearance or shape of a family of solutions curves to the differential equation.
So, all we have to do is construct a table of values where we plug in ordered pairs into our differential equation and plot the result as a short line segment.
Example
For example, suppose we have the differential equation \(\frac{d y}{d x}=2 x+y\) and we want to create a slope field.
Drawing Slope Fields
Direction fields are just like the graphs we constructed in calculus 1 and 2 when drawing slope fields.
Understanding Solution Behavior through Direction Fields
But how does this help us understand the behavior or solution of the differential equation, when there is no explicit solution or formula to be found?
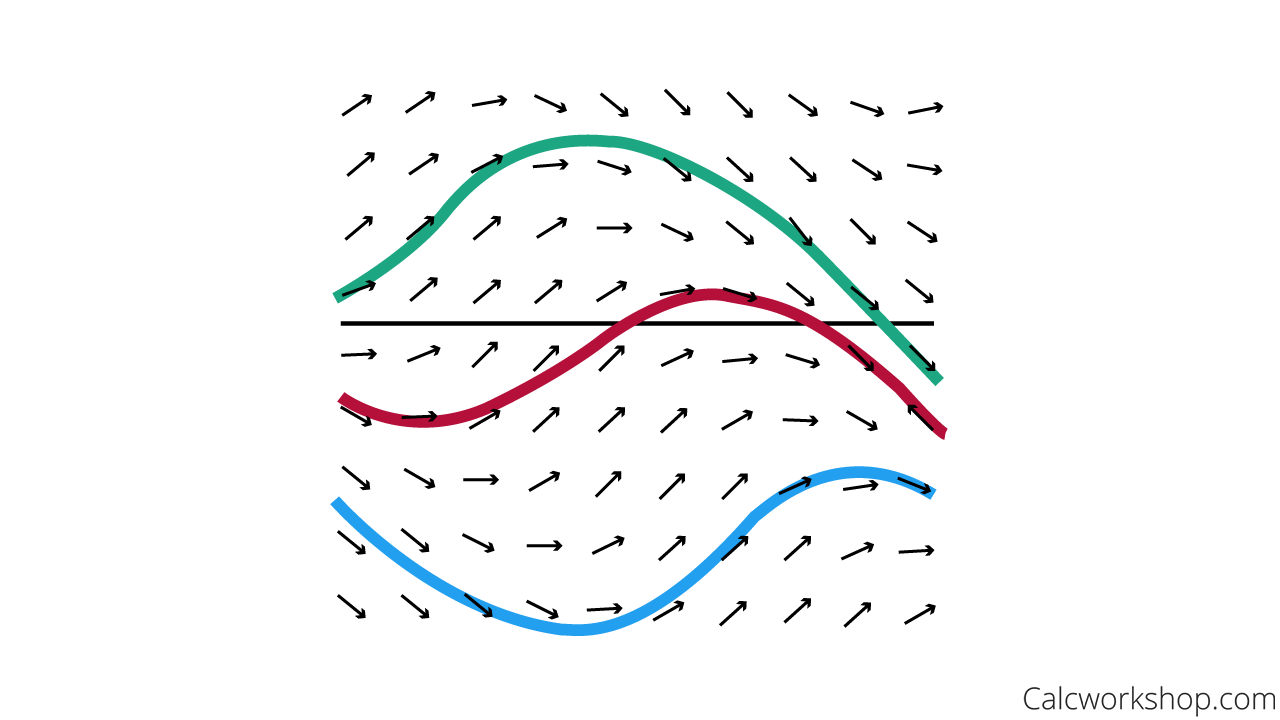
Look at the image below, which shows the direction field for the differential equation \(\frac{d y}{d x}=\sin (x+y)\)
Direction Field — Solution Curve
Notice that there are three solution curves that passes through the slope field, each following the flow pattern of the field.
Observe how the direction field suggests the appearance or shape of a family of solution curves of the differential equation; thus, we obtain an understanding of its behavior.
Cool!
Autonomous First-Order Differential Equations
Alright, so now let’s talk about a special type of first order differential equation, for which a special type of graph is constructed – autonomous first order DEs.
An ordinary differential equation in which the independent variable, \(\mathrm{x}\), is missing from the right side is said to be autonomous and is written in the form as \(\frac{d y}{d x}=f(y)\).
For instance.
An autonomous ODE is when \(\frac{d y}{d x}=f(y)\), meaning the derivative is a function of only one variable, \(\mathrm{y}\).
\[
\frac{d y}{d x}=1-y^2
\]
A non-autonomous ODE is when \(\frac{d y}{d x}=f(x, y)\), meaning the derivative is a function of more than one variable. Namely, \(\mathrm{x}\) and \(\mathrm{y}\).
\[
\frac{d y}{d x}=y^2-x y
\]
Phase Portraits for Autonomous DEs
If a differential equation is autonomous, we can construct a phase-portrait.
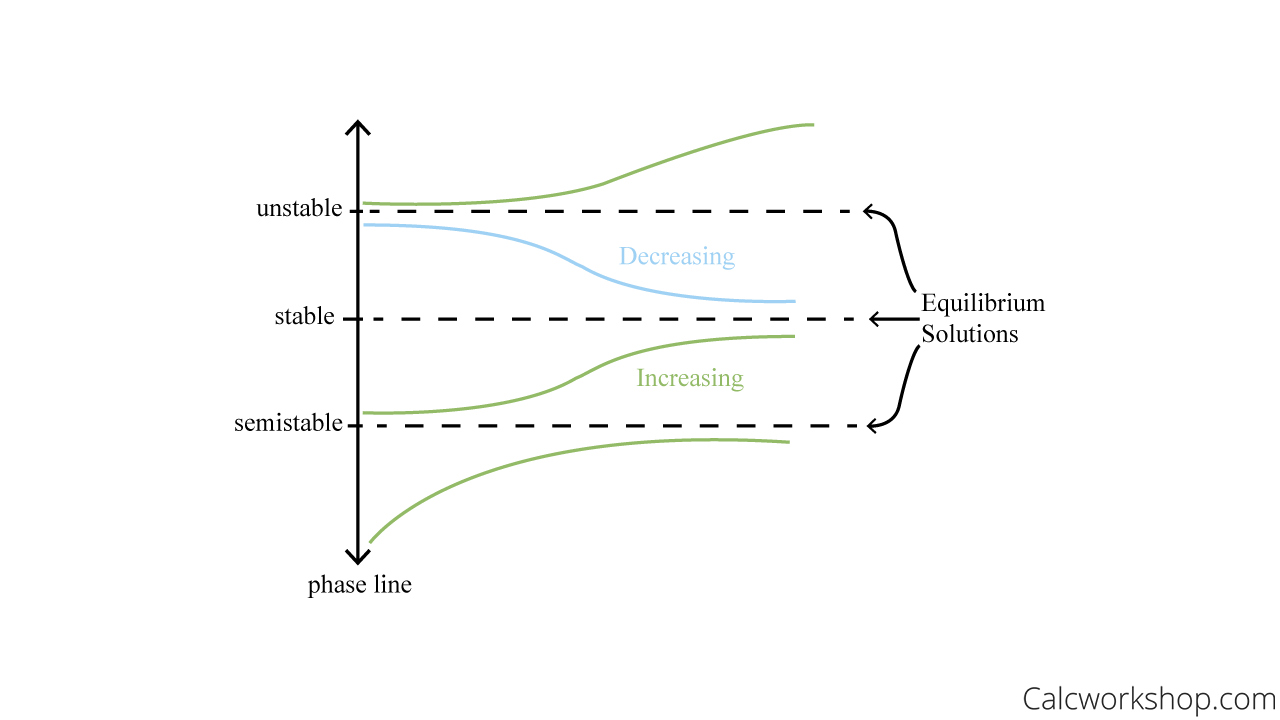
A phase portrait is constructed vertically and highlights several key components:
- Equilibrium points (also known as stationary points or critical points)
- Increasing and decreasing intervals
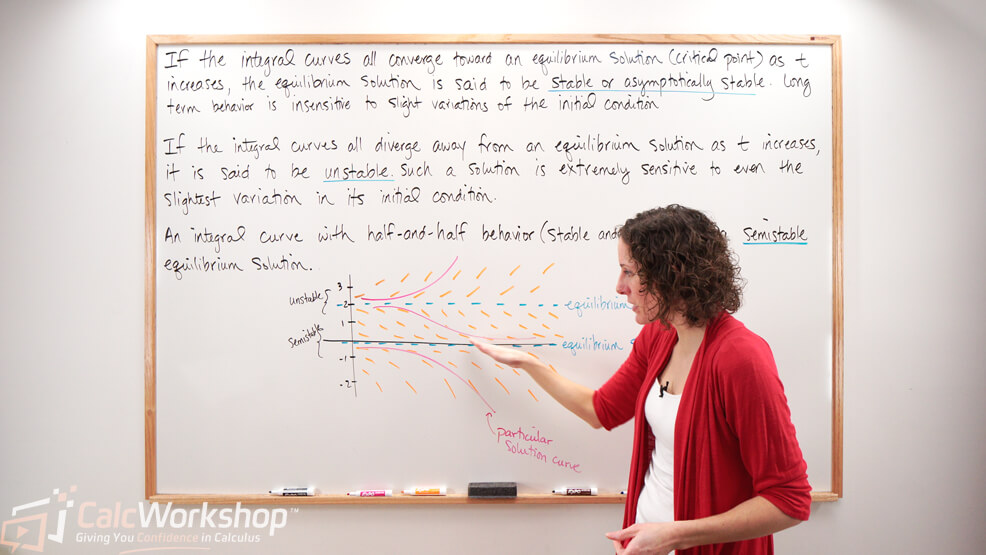
Equilibrium points occur when \(\frac{d y}{d x}=f(y)=0\) and the stability of an equilibrium solution is classified according to the direction field, sometimes called the integral curve.
Remember the first derivative test, where we set the derivative equal to zero and tested the critical values on a number line to determine increasing and decreasing intervals as well as potential maximum and minimum values?
Well, this is the same thing! The only difference is that we are going to graph the solution vertically and use our critical points (i.e., equilibrium solutions) to help us understand the behavior of the autonomous differential equation in terms of its stability.
Determining Stability with Phase Portraits
Here are the steps we will use to determine stability and how we graph a phase portrait:
- Set the autonomous DE equal to zero and solve for equilibrium solutions (i.e., critical values).
- Place equilibrium values on a number line and check for increasing and decreasing intervals, similar to the first derivative test.
- Interpret the results:
- If the number line yields a local minimum, then the autonomous DE is considered unstable.
- If the number line yields a local maximum, then the autonomous DE is considered stable.
- If the number line yields neither a local minimum nor maximum, then the autonomous DE is considered semi-stable.
- Graph the resulting phase portrait.
Classify Equilibrium Points — Phase Portrait
Attract and Repel Graphs
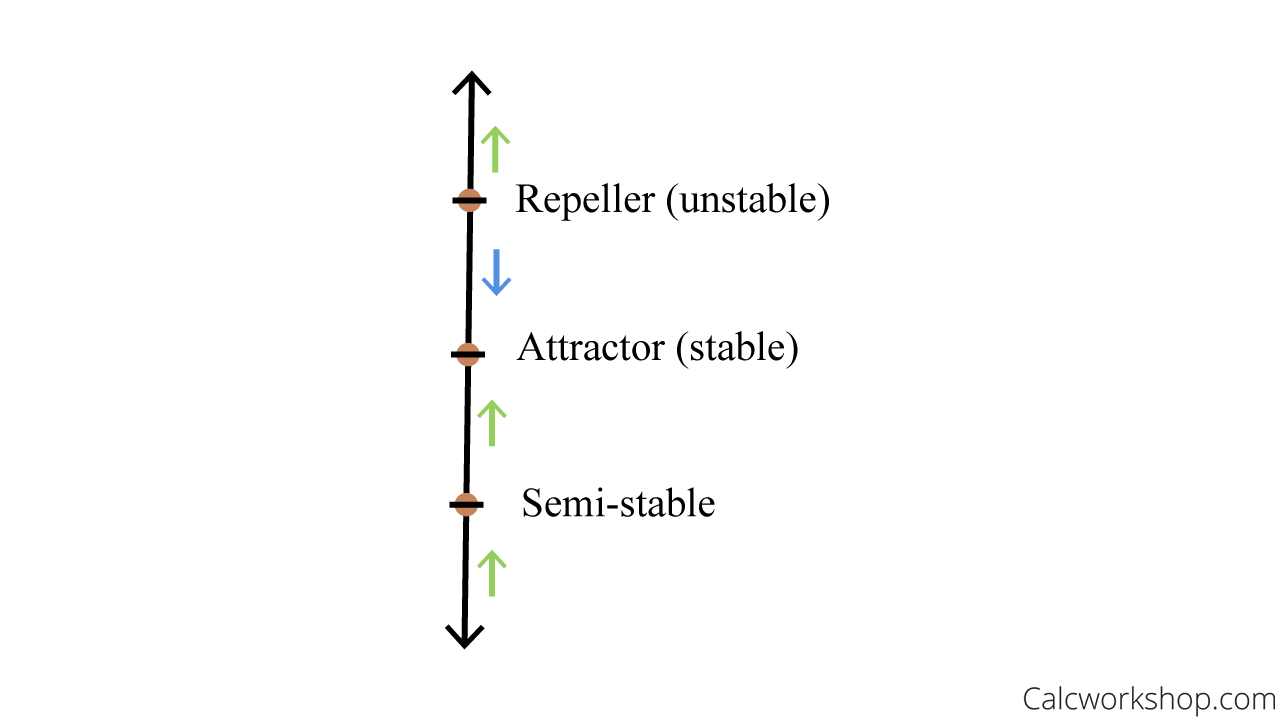
Moreover, this type of graph is also referred to as an attract or repel graph. Using the phase portrait as seen above, we can observe how the increasing and decreasing intervals either point toward or away from the critical points. In other words, they are:
- Attracted (stable) to each other
- Repelled (unstable) from one another
Attractor Repeller — Critical Points
Don’t worry. We’ll work through examples of how this works in our lesson, as the process is really quite simple.
What You Will Learn
- Find a direction field for a differential equation
- Sketch an approximate solution curve passing through a given point
- Find critical points and phase portraits for autonomous first-order differential equations
- Classify each equilibrium point as stable, unstable, or semi-stable
It’s going to be great!
Video Tutorial w/ Full Lesson & Detailed Examples
Get access to all the courses and over 450 HD videos with your subscription
Monthly and Yearly Plans Available
Still wondering if CalcWorkshop is right for you?
Take a Tour and find out how a membership can take the struggle out of learning math.