How to find a population proportion is an essential skill in statistics.

Jenn, Founder Calcworkshop®, 15+ Years Experience (Licensed & Certified Teacher)
In today’s lesson, you’ll learn how to do precisely that.
You’ll see how to calculate confidence intervals for population proportion with simple to follow steps.
With seven worked examples. You’ll have everything you need.
Before we get too far, let’s jump in with the basics first.
A statistic, a numerical value that describes a characteristic of the data obtained in a sample, can help us draw powerful conclusions about a parameter, which is a numerical value that represents a population’s characteristics.
There are two major statistical inference methods:
- Confidence Intervals
- Hypothesis Testing
We will discuss confidence intervals in this unit and save hypothesis testing for the next chapter.
So, what is an interval estimate?
A confidence interval is an interval estimate that incorporates a point estimate and the sampling variability.
All this means is that we are going to find a statistic that we believe estimates a parameter, either a sample mean or a sample proportion. Then we are going to determine how accurate that value is in estimating the true population by creating an interval that says the “real value” will fall within a calculated range a certain percentage of the time.
This means that a confidence interval will give you more than just a single value. It will provide you with both a lower estimate and upper estimate, where the actual value is within this specified interval.
Confidence Interval For Population Proportion
For example, let’s say you want to know the percentage of people in your state that smoke.
Polling every person in the state is not feasible, so you conduct a simple random sample of 1,000 people and ask them their smoking preference and determine that 7% of them indicate they smoke.
The percentage of the sample who said they smoke (7%) is your estimated proportion, and this number helps you estimate the actual percentage of people who smoke in your state.
But that single number alone doesn’t give you, or your audience, much confidence.
How accurate is it?
Wouldn’t it be better to have a range of values where the true proportion could lie? This will give greater confidence to your estimated proportion.
Think about it, which statement do you think is better?
- The true percentage of smokers in your state is 7%.
- Or the true percentage of smokers in your state is between 5% and 9%.
Yep, intervals give more confidence!
How To Calculate Confidence Interval
Where the margin of error is the product of the distribution critical value and the standard deviation, also called the standard error of the estimate.
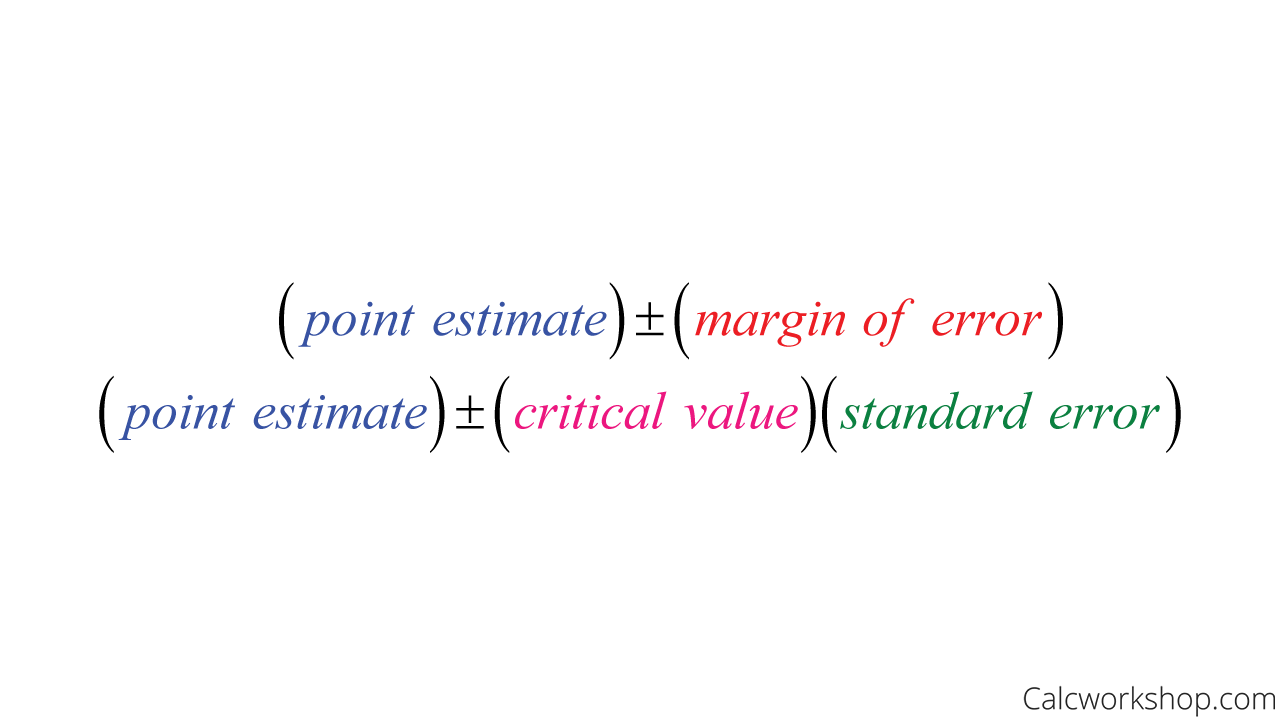
Confidence Interval Formula
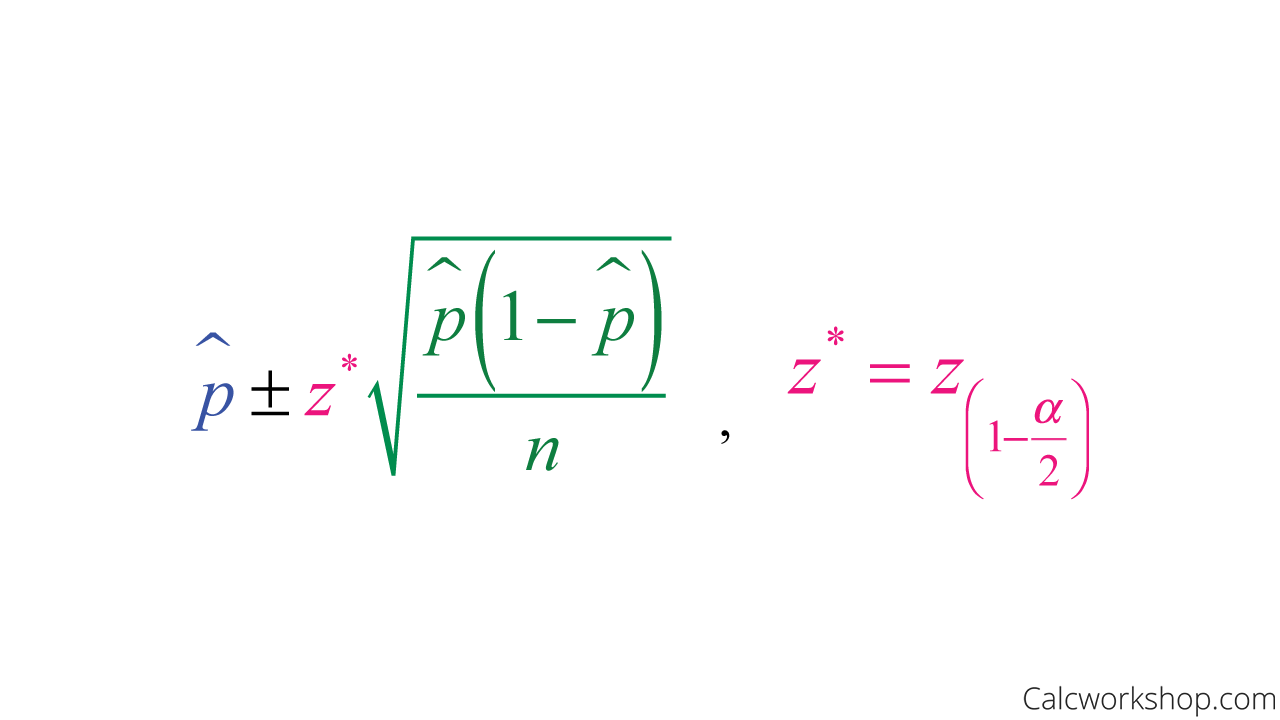
Confidence Interval for Population Proportion Formula
The distribution critical value, or z-star as it is sometimes called, represents the critical value of the standard normal curve corresponding to a specified confidence level.
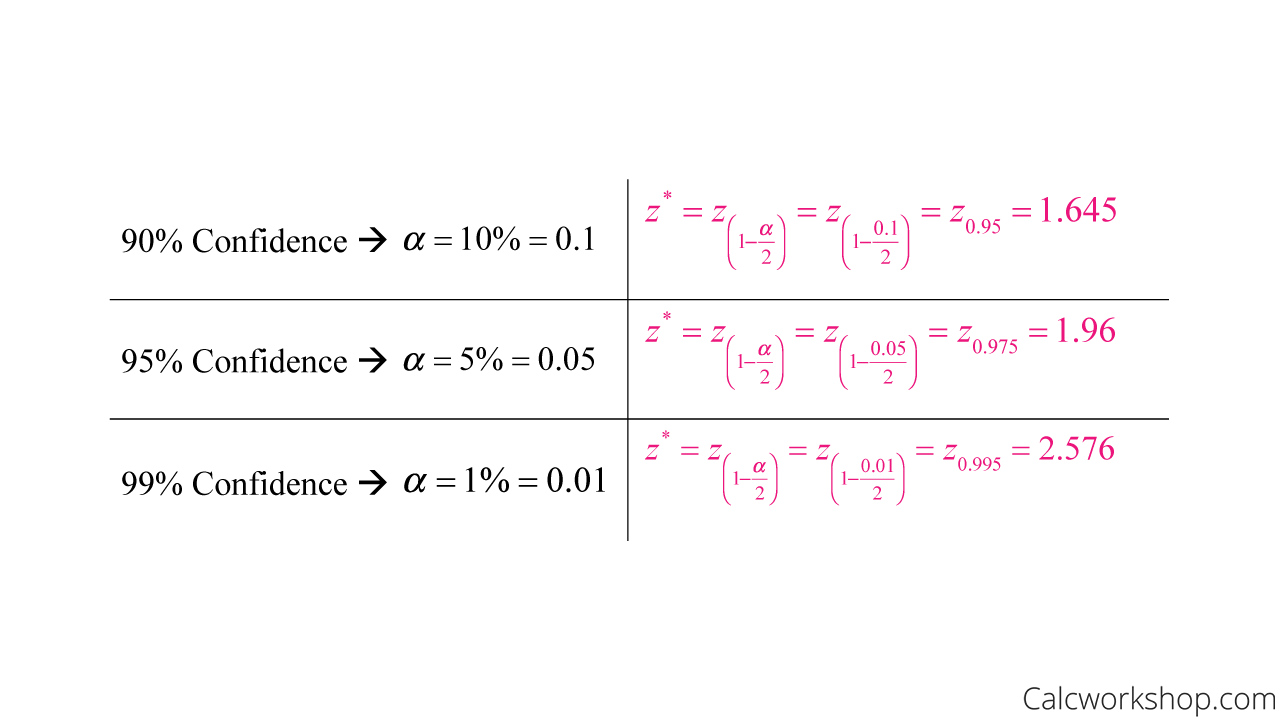
How Do You Find The Critical Value
And the most common confidence levels are as follows:
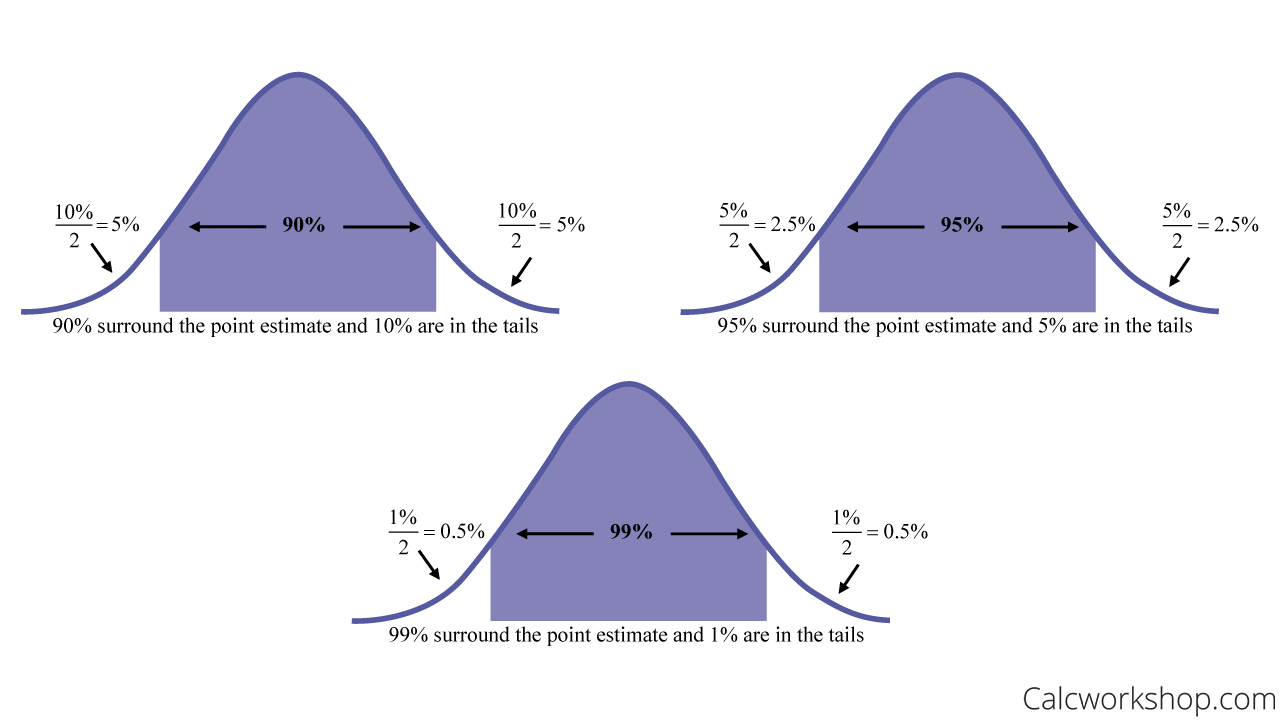
How To Interpret Confidence Intervals
Worked Example
So back to our example. If we determined that 7% of the 1000 sampled smoke, and we wanted to create 90% confidence interval, then we would perform the following steps:
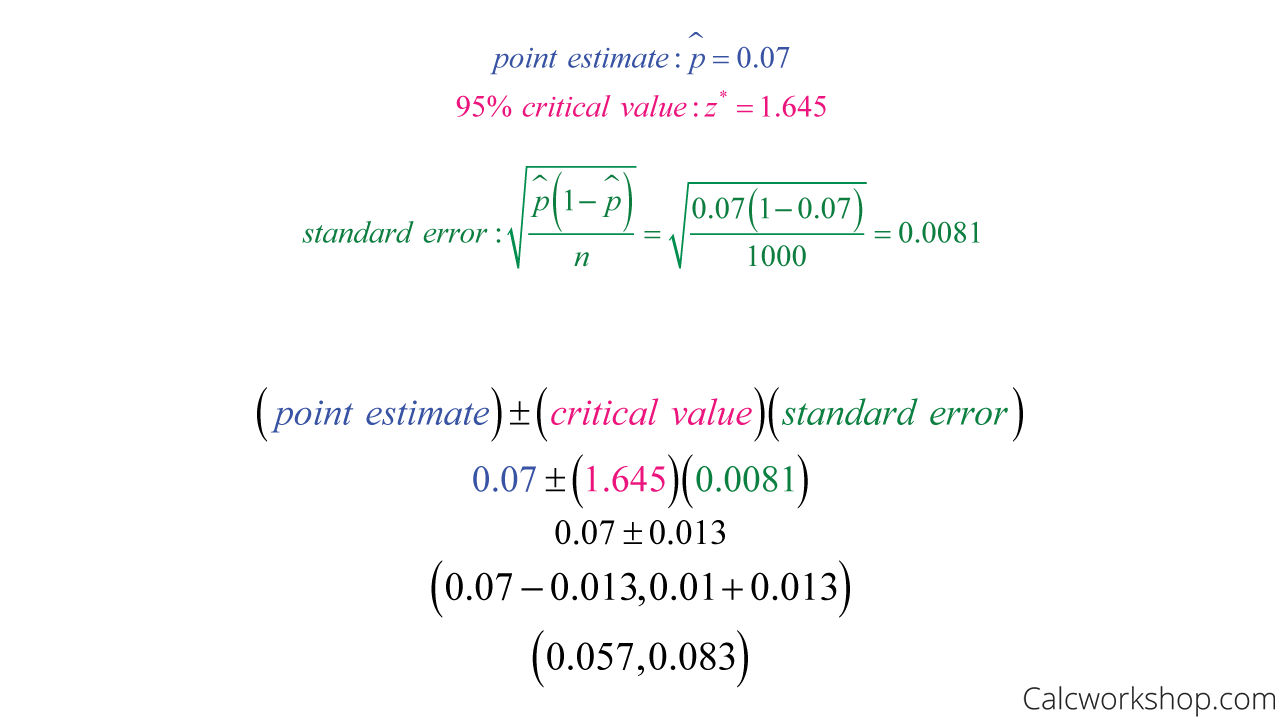
How Do You Calculate a 90% Confidence Interval
This means that we are 90% confident that the true proportion of smokers in the state is between 5.7% and 8.3%.
Note, if you aren’t given a confidence interval, then we always assume 95% confidence because it is considered a conservative estimation.
Please note that a confidence interval is not a probability interval. It doesn’t say that the percentage of smokers in the state have a 90% chance of falling inside the interval. Rather, 90% of all interval estimates will capture or contain the true percentage of smokers.
But what happens when we want to find the difference between two population proportions?
Do you keep it or turn it in to the authorities? If males and females are randomly sampled, is the proportion of people that said they would keep the $100 different for males and females?
To determine this, we will need to use a confidence interval for the difference of two proportions, which we’ll discuss in the video below.
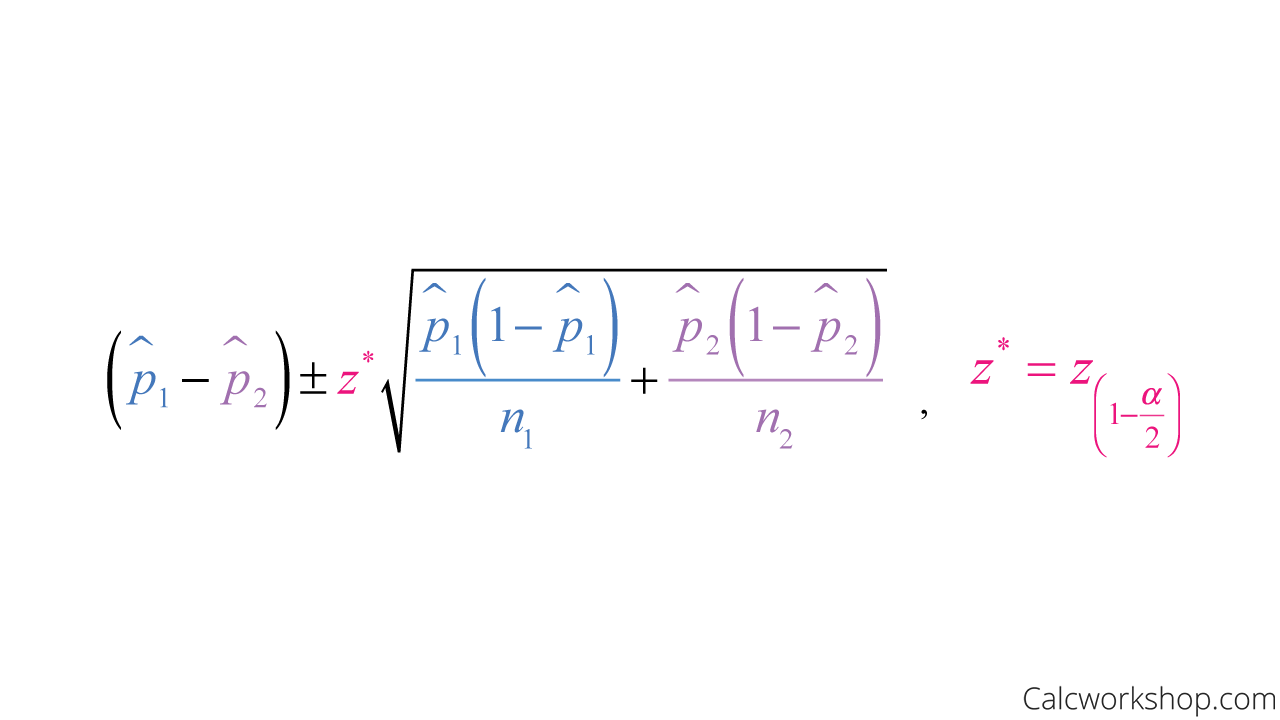
Confidence Interval Formula for Two Proportions
Additionally, we will explore how the change in the significance level will affect our confidence interval.
- As the confidence level increases, the margin of error will also increase because the wider the confidence interval, the more room for error.
- Likewise, the margin of error decreases as the sample size increases.
Together we will also learn how to choose an appropriate sample size for an estimation for a desired margin of error, as well as develop an easy acronym that will help us remember the steps for constructing a confidence interval as we walk through countless examples to help us master the technique.
Population Proportion – Lesson & Examples (Video)
59 min
- Introduction to Video: Confidence Intervals for Population Proportions
- 00:00:42 – What is a confidence interval? Overview, Properties, and Checklist
- Exclusive Content for Members Only
- 00:11:40 – How do you construct an interval estimate for one-sample proportions?
- 00:20:16 – Create a 95% confidence interval for a one-sample proportion (Example #1)
- 00:27:00 – Construct a 90% confidence interval for a one-sample proportion (Example #2)
- 00:31:22 – Find a 99% confidence interval for a one-sample proportion (Example #3)
- 00:36:18 – Choosing a sample size for the estimation of p (Examples #4-5)
- 00:45:49 – How to construct a two-sample interval estimate for population proportions?
- 00:47:19 – Construct a 95% confidence interval for two-sample population proportions (Examples #6-7)
- Practice Problems with Step-by-Step Solutions
- Chapter Tests with Video Solutions
Get access to all the courses and over 450 HD videos with your subscription
Monthly and Yearly Plans Available
Still wondering if CalcWorkshop is right for you?
Take a Tour and find out how a membership can take the struggle out of learning math.