What are the different types of sampling methods?

Jenn, Founder Calcworkshop®, 15+ Years Experience (Licensed & Certified Teacher)
And how are they used in statistics?
All great questions, that we’ll cover in today’s lesson.
So let’s go!
How we collect data is an essential aspect of the statistical process for us to draw accurate conclusions about a population.
There are four major types of data collection:
- Census
- Sample Surveys
- Controlled Experiments
- Observational Studies
In this video lesson, we will focus on the first two types of data collection, and leave experiments and observational studies for our next lesson.
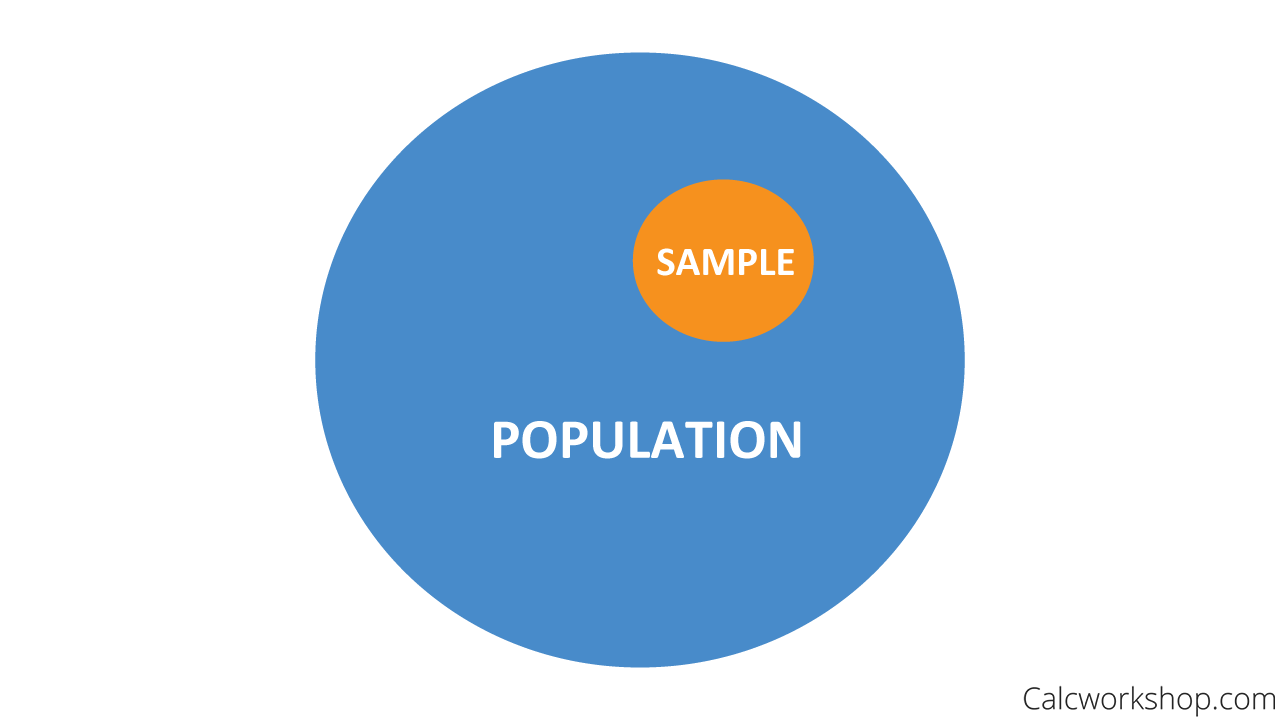
Okay, so the entire collection of people or objects we are interested in is called a population, and the statistical measurement we use is called a parameter.
So what’s an example of a population parameter? Census!
Census
A census counts every living person in the United States and the five US Territories. In other words, it is a complete count of everyone, which then helps the US government in allotting federal funds, grants, and support to states and local communities based on population, age, gender, etc.
But collecting data from an entire population isn’t always feasible or even practical. So, how can we make inferences about the population without collecting data from everyone?
Sample Survey
Okay, so what is important to know about sampling?
A sample survey sometimes called a cross-sectional study, selects a random sample, or cross-section, from the population of all individuals or objects about which you desire information.
Now, a sample is a subset or a portion of the population. The statistical measure we use is called a statistic and is used to help us estimate the characteristics of a population.

Population Vs Sample
Think of it this way, imagine you’re making spaghetti, and you want to determine if it’s ready or not. Should you eat every noodle to decide whether or not it’s ready to eat, or should you choose to eat a few spaghetti noodles to test their doneness?
Of course, you would choose a few to draw a conclusion about the rest. And this is the idea about sampling!

Sampling In Real Life
While the Greek letters mu or sigma generally represent parameters, we use English letters like x-bar, s, and p-hat to identify statistics.
Here’s an easy way to remember that population is equated with parameter and sample equates with statistic!

Population Parameter Sample Statistic Memory Tool
Sampling Errors
Now, with all sampling, there is the possibility of error, but we want to do our best to avoid random sampling errors because they can influence our analysis and conclusions (inferences).
Some errors occur because of improper sampling techniques, such as:
- Convenient Sampling
- Voluntary Response Sampling
- Variability
Convenience Sampling
A convenient sample is when members or objects are chosen based on convenience and availability. For example, suppose you are interested in studying people’s opinions about a new park in the community. So you go to the park and interview a select few of people who are at the park. Unfortunately, this type of sampling is limited in scope and can have a high amount of bias, which is prejudice in favor of or against one thing, person, group, etc.
Voluntary Response Bias
Another type of sampling that we want to avoid is voluntary response sampling. This is seen particularly in opinion surveys, as members of the populations decide whether or not to respond or state their opinion on a matter. Call-in or mail-in surveys are perfect examples of voluntary responses and typically solicit strong views resulting in sampling bias.
Variability
The third type of sampling to avoid is variability. An increase or decrease in sample size will impact your samples’ quality and the accuracy of your conclusions. For example, suppose you want to know how students feel about the food quality in the cafeteria.
Which would be better?
- Interviewing ten students
- Or 100 students
Increasing the number of students (i.e., increasing the sample size) will reduce random sampling error.
Think of it this way, your sample size should be large enough to be an accurate representation of the population you wish to study, and also large enough to achieve statistically significant results. The more you sample, the better your results will be.
So, what are examples of good sampling?
- Simple Random Samples
- Stratified Random Samples
- Systematic Random Samples
- Cluster Sampling
Simple Random Sample
A simple random sample (SRS) is when every experimental unit has the same chance, or equal chance, of being selected for the sample. Every possible sample has an equal opportunity of being chosen as well as noted by Stat Trek.
For example:
- Flipping a coin to decide who goes first.
- Rolling a die to determine which group or team a person will join.
- Pulling names out of a hat to select a winner.
- Or even using a table of random digits.
A table of random digits are numbers that are randomly organized in rows and columns in a table and are usually arranged in 5-digit groups. The example below shows you how to use one in random sampling.
Example

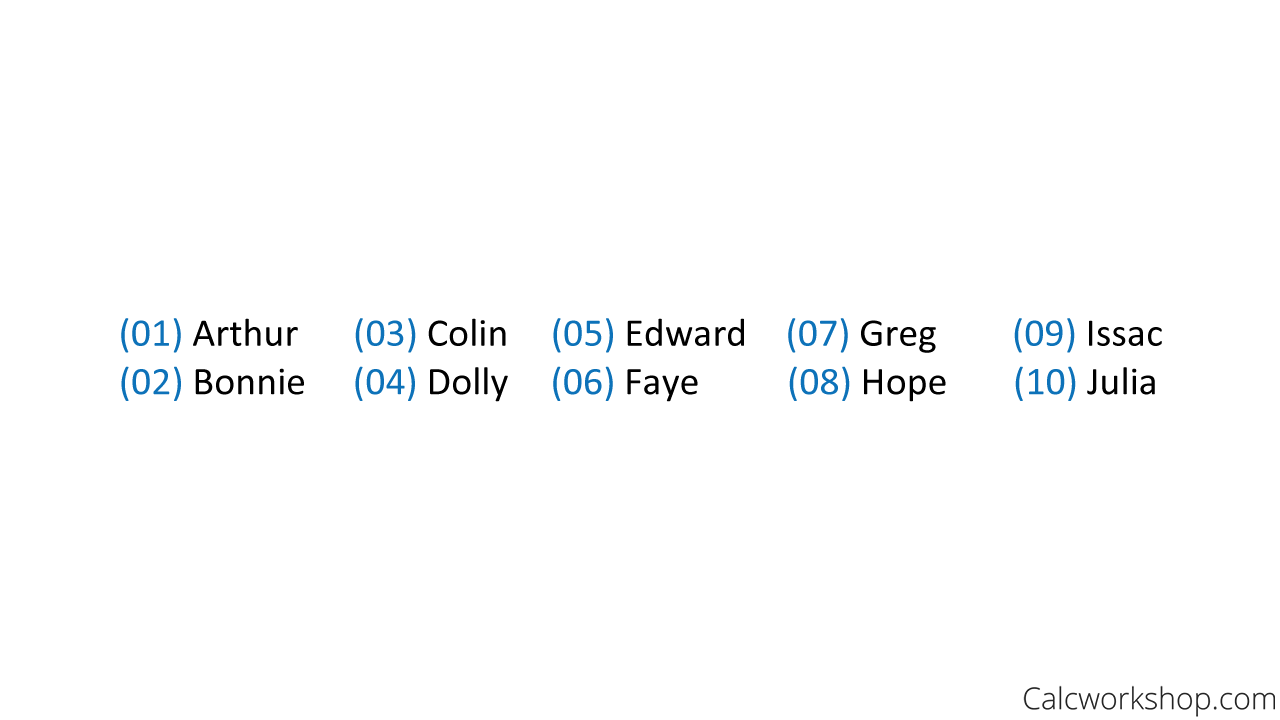
Table Of Names

How To Make A Random Number Table
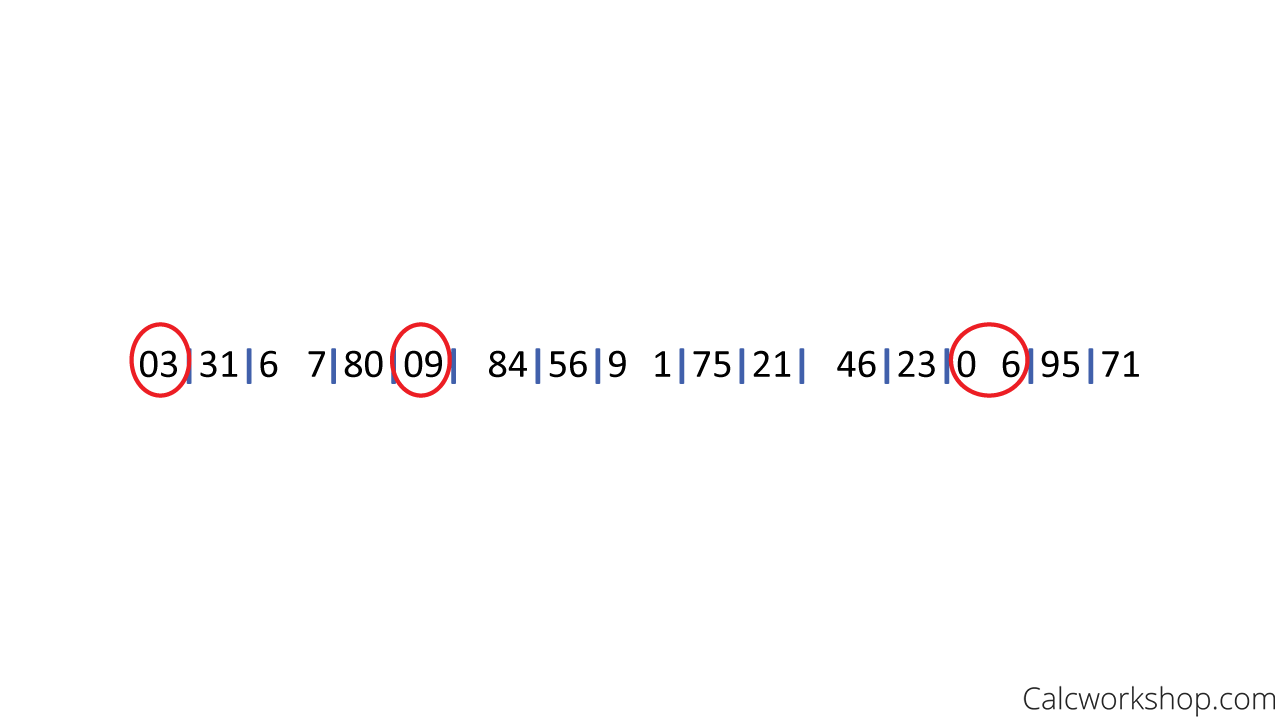
Then she selects one line from the table of random digits and goes across the line, recording two-digit numbers until she has found three numbers within the range of 01 and 10.

Table Of Random Digits

How To Use A Random Number Table
The table gave us 03, 09, and 06. She then matches the selected numbers to the names of students, and it looks like Colin, Isaac, and Faye will be attending the meeting.
Stratified Sampling
A Stratified Random Sample divides the population into smaller groups, called strata, with similar traits, and then, it selects a simple random sample from each group. For example, you group males and females first, and then select a sample of people from within each group.
Systematic Sampling
A Systematic Random Sample begins with the listing of the population and then decided to choose members, starting from a fixed point systematically. For example, you decide to sample 1 out of every ten people in a movie theater about the entertainment experience. So, you select the first person to interview, and from there, you sample every 10th person from that point onward.
Cluster Sampling
And lastly, there is something called Cluster Sampling. This is when a population is broken down into groups, and then every member within that group is sampled.
For example, suppose a school district, comprised of 14 schools, wants to implement a new reading model for approximately 15% of the 3,000 students in the area. Rather than randomly selecting students from the 14 different schools, the district decides to choose four schools, and implement the new reading model for all students in those schools.
Now, it is essential to note that bias occurs naturally in all samples.
But there are three ways we can minimize such sampling errors:
- Bias due to Undercoverage
- Nonresponse Bias
- Response Bias
Undercoverage occurs when some members of the population are left out. Nonresponse Bias is when an individual chosen for a sample can not be contacted or refuses to participate. And Response Bias happens when a respondent records the incorrect answer. Typically, when a person lies, the questions are misleading or confusing, or the wording of the question influences a particular response.
Example
Suppose a newspaper company surveys to estimate whether or not the city’s residents favor the new toll road. They take a sample of 100 subscribers and sends them a questionnaire that asks, “Do you think having to pay money to drive on the highway is fair?” And after analyzing the results from the 13 people who replied, the newspaper reports that 74% of the city’s residents oppose the new toll road. Identify the sampling bias due to under coverage and nonresponse, and identify the response bias due to the way the question was asked.
The sampling bias due to undercoverage is that not all parts of the city were represented, only 100 newspaper subscribers were given a questionnaire.
The sampling bias due to due to nonresponse is shown in the fact that only 13 of the subscribers responded to the survey. This means that those 13 subscribers most likely have strong opinions regarding the toll road and that 77 subscribers either didn’t receive the questionnaire or refused to participate.
And the response bias is found in the way the question was worded. The question is framed in a negative way, which can lead subscribers to respond unfavorably.
There’s a lot to unpack in this lesson.
But don’t worry, because together we are going to look at countless examples of how to collect data that ensures a good sample design, and learn how we can avoid sampling errors such as sampling bias.
Sampling Methods – Lesson & Examples (Video)
40 min
- Introduction to Video: Sampling and Surveys
- 00:00:29 – Overview of Population, Sample, Surveys, Bias, and Bad Sampling
- Exclusive Content for Members Only
- 00:05:48 – What are the four types of Sampling Bias and what makes for Good Sampling?
- 00:13:16 – Identify the population, sample and bias (Example #1)
- 00:17:54 – Using a Table of Random Digits, create a sample (Example #2)
- 00:28:08 – What type of sampling (SRS, Cluster Sampling, Stratified Sampling, Systematic Sampling) is being used (Example #3)
- 00:31:12 – Identifying wording bias (Example #4)
- 00:36:11 – Determine whether the numerical value is a parameter or a statistic (Example #5)
- Practice Problems with Step-by-Step Solutions
- Chapter Tests with Video Solutions
Get access to all the courses and over 450 HD videos with your subscription
Monthly and Yearly Plans Available
Still wondering if CalcWorkshop is right for you?
Take a Tour and find out how a membership can take the struggle out of learning math.