What is a population parameter?

Jenn, Founder Calcworkshop®, 15+ Years Experience (Licensed & Certified Teacher)
That’s exactly what you’re going to learn in today’s statistics lesson.
You’ll learn how to calculate population parameters with 11 easy to follow step-by-step video examples.
Review of the basic terminology and much more!
So here we go…
How do you learn about the nature of a population when you can’t feasibly test every one or everything within a population?
We use a sample!
Although we discussed sampling methods in our Exploring Data chapter, it’s important to review some key concepts and dig a little deeper into how that impacts sampling distributions.
Let’s jump in with some terminology.
Sample Statistics vs Population Parameters
When we compute a statistical measures about a population we call that a parameter, or a population parameter. And when we compute statistical measure about a sample we call that a statistic, or a sample statistic as noted by Penn State.

Real World Examples of a Parameter Population
Think of it like this. Imagine you want to know if an apples is ripe and ready to eat. So, you take a bite of the apple to see if it’s good. If the apple tastes crunchy, then you can conclude that the rest of the apple will also be crunchy and good to eat. But if the bite from the apple is mushy, then you can infer that the rest of the apple is mushy and bad to eat. Hence, the bite from the apple is a sample statistic, and the conclusion you draw relates to the entire apple, or the population parameter.
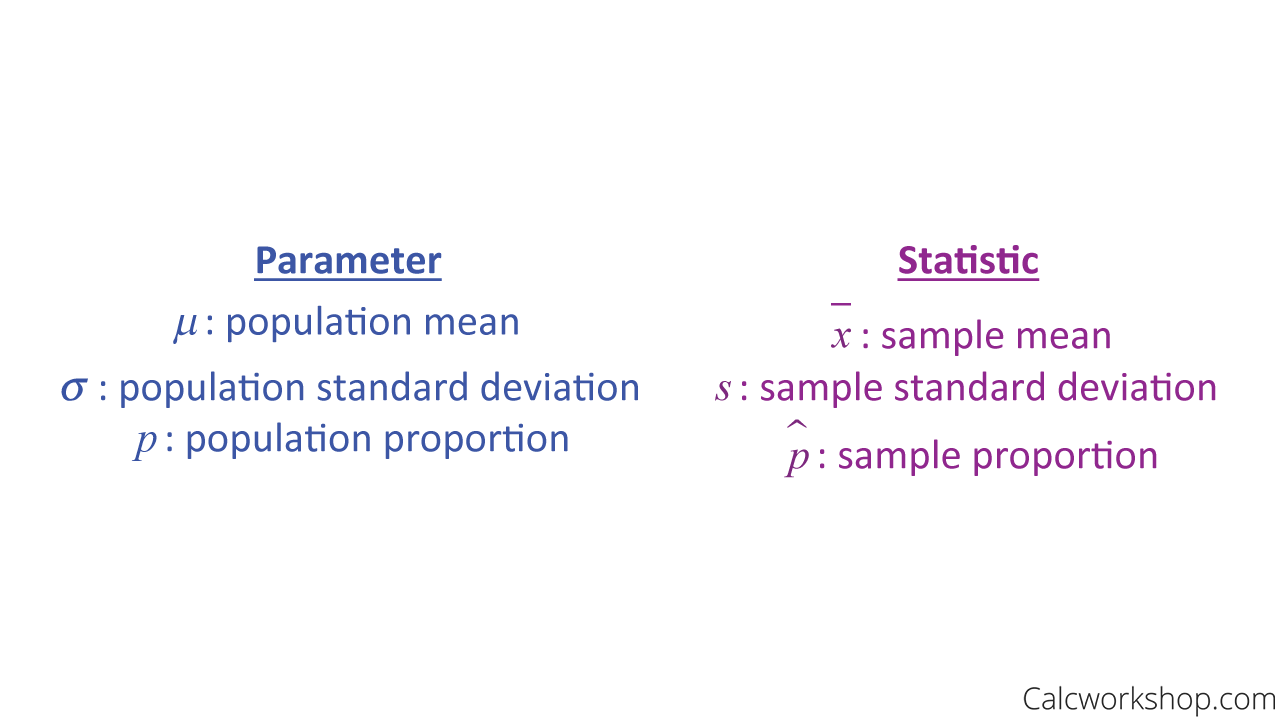
We typically use Greek letters like mu and sigma to identify parameters, and English letters like x-bar and p-hat to identify statistics.

Parameter Vs Statistic
Sampling Error
Now, with all samples, surveys, or experiments, there is the possibility of error. Sampling error is the error that occurs because of chance variation. It’s the difference between a statistic and parameter (i.e., the difference between the sample and the population). The best way to reduce sampling error is to increase the sample size.
Some errors can occur with the choice of sampling, such as convenient sampling, or in the response of sampling, such as those errors that we can accrue with collection or recording of data. This type of error is called non-sampling error.
Sampling Distribution
But why do we care?
Well, we hope to draw inferences about probability distributions by analyzing sampling distributions.
A sampling distribution is a probability distribution obtained from a larger number of samples drawn from a specific population. In other words, it’s the distribution of frequencies for a range of different outcomes that could occur for a statistic of a given population.
If we know that the population distribution is normal, then the sampling distribution will also be normal, regardless of the size of the sample. If the population is not normal, meaning it’s either skewed right or skewed left, then we must employ the Central Limit Theorem.
What Is The Central Limit Theorem?
The Central Limit Theorem (CLT) states that if a random sample of n observations is drawn from a non-normal population, and if n is large enough, then the sampling distribution becomes approximately normal (bell-shaped). In other words, the central limit theorem allows us to accurately predict a population’s characteristics when the sample size is sufficiently large.

Central Limit Theorem — Definition
Put another way, if we have a large enough sample, then the sampling distribution becomes approximately normal. We can use all of our old tricks to find probability like z-scores and z-tables!
So, what is our ultimate goal?
We want to find an appropriate sample statistic, either a sample mean or sample proportion, and determine if it is a consistent estimator for the populations as a whole.

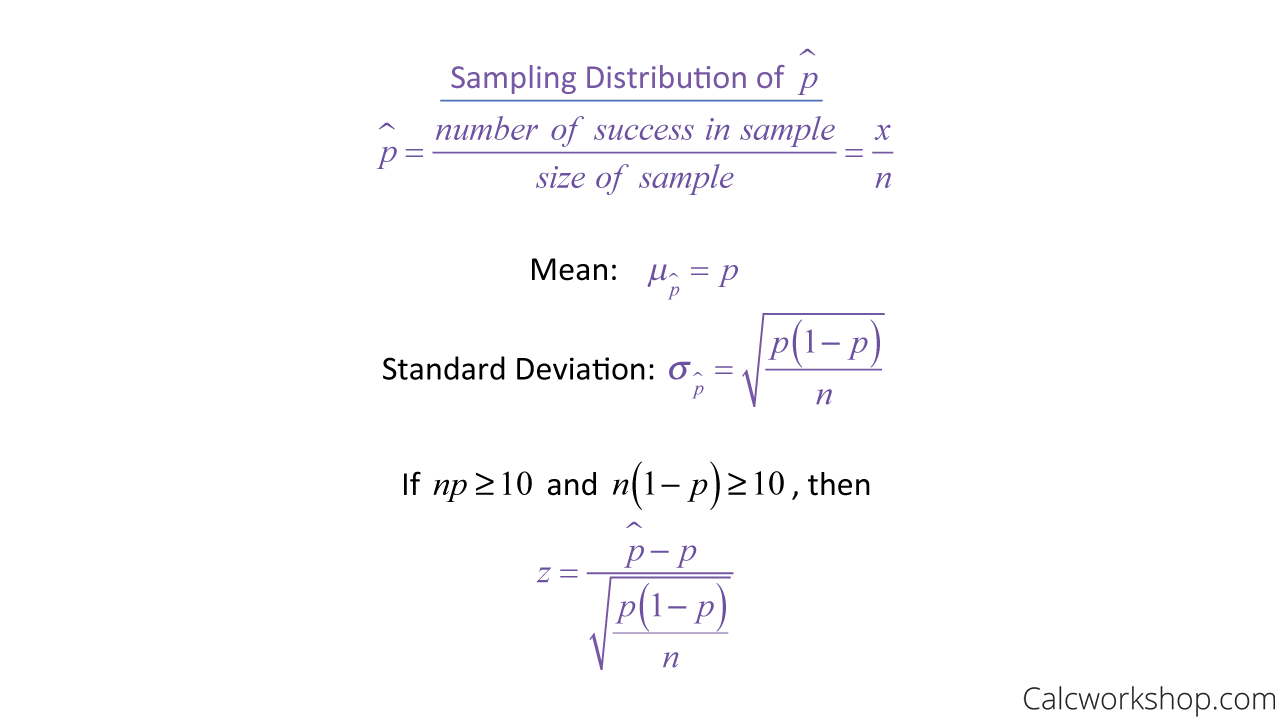
Sample Proportion Properties

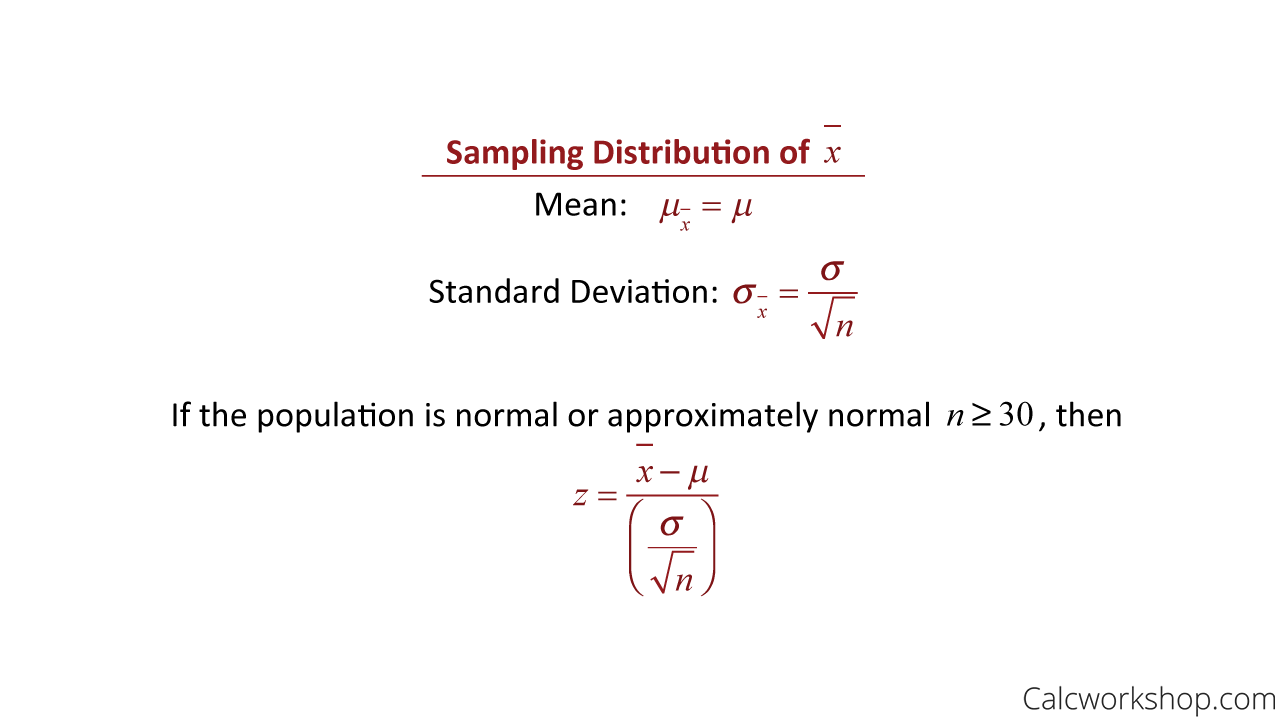
Sample Mean Properties
How To Find Population Parameters
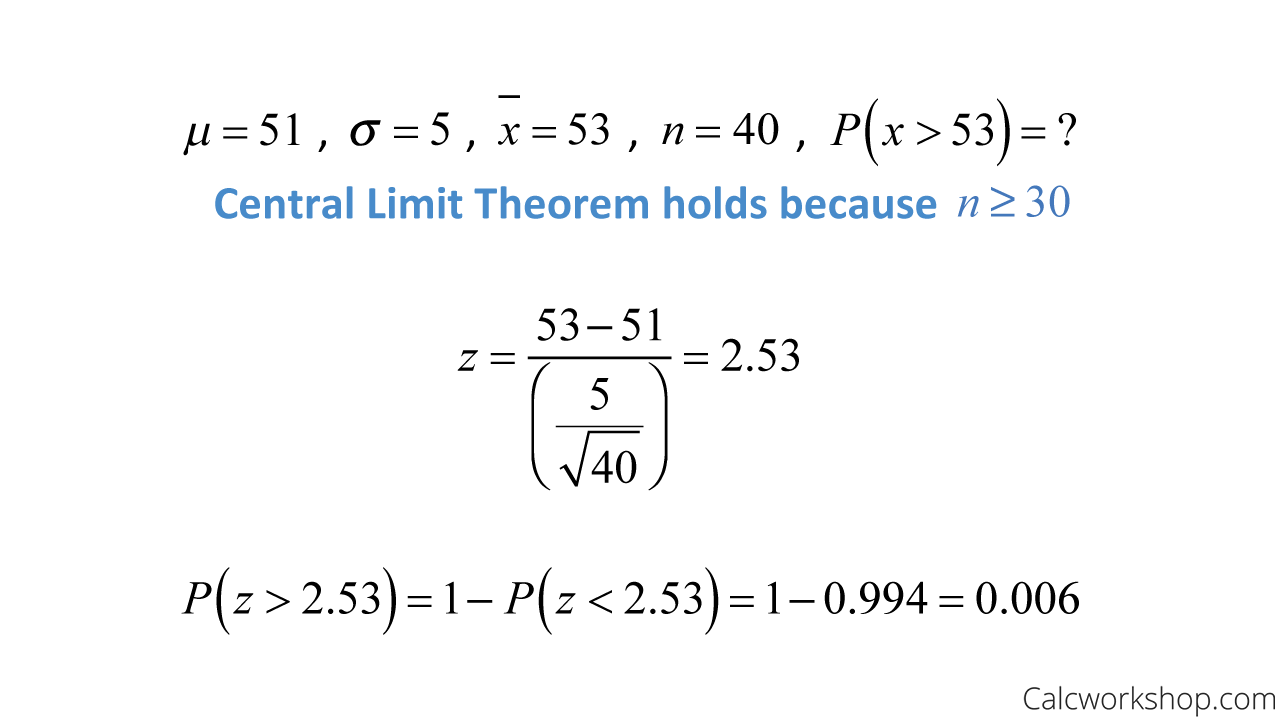
For example, suppose a highway construction zone, with a speed limit of 45 mph, is known to have an average vehicle speed of 51 mph with a standard deviation of five mph, what is the probability that the mean speed of a random sample of 40 cars is more than 53 mph?

Population Parameter — Example
Together, we will look at how to find the sample mean, sample standard deviation, and sample proportions to help us create, study, and analyze sampling distributions, just like the example seen above.
Population Parameter – Lesson & Examples (Video)
1 hr 11 min
- Introduction to Video: Sample Means and Sample Proportions
- 00:00:37 – What is the difference between a parameter and a statistic? with Example #1
- Exclusive Content for Members Only
- 00:09:07 – Identify the parameter and statistic for the following scenarios (Examples #2-4)
- 00:14:09 – Create a population distribution and a sampling distribution (Example #5)
- 00:21:47 – What is the difference between sampling error and non-sampling error?
- 00:28:19 – Given the sample data find the sample mean and sample standard deviation (Example #6)
- 00:31:26 – Properties of Sampling Distribution for Sample Means, Illustrations and the Central Limit Theorem
- 00:37:47 – Find the probability for an approximately normal distribution using sample means(Example #7-8)
- 00:49:45 – Properties of Sampling Distributions for Sample Proportions with Example #9
- 00:59:48 – Find the probability for an approximately normal distribution using sample proportions (Examples #10-12)
- Practice Problems with Step-by-Step Solutions
- Chapter Tests with Video Solutions
Get access to all the courses and over 450 HD videos with your subscription
Monthly and Yearly Plans Available
Still wondering if CalcWorkshop is right for you?
Take a Tour and find out how a membership can take the struggle out of learning math.