Wouldn’t it be nice to be able to find the likelihood of an event occurring without having to do too much work?

Jenn, Founder Calcworkshop®, 15+ Years Experience (Licensed & Certified Teacher)
This is the beauty behind normal distribution and the empirical rule!
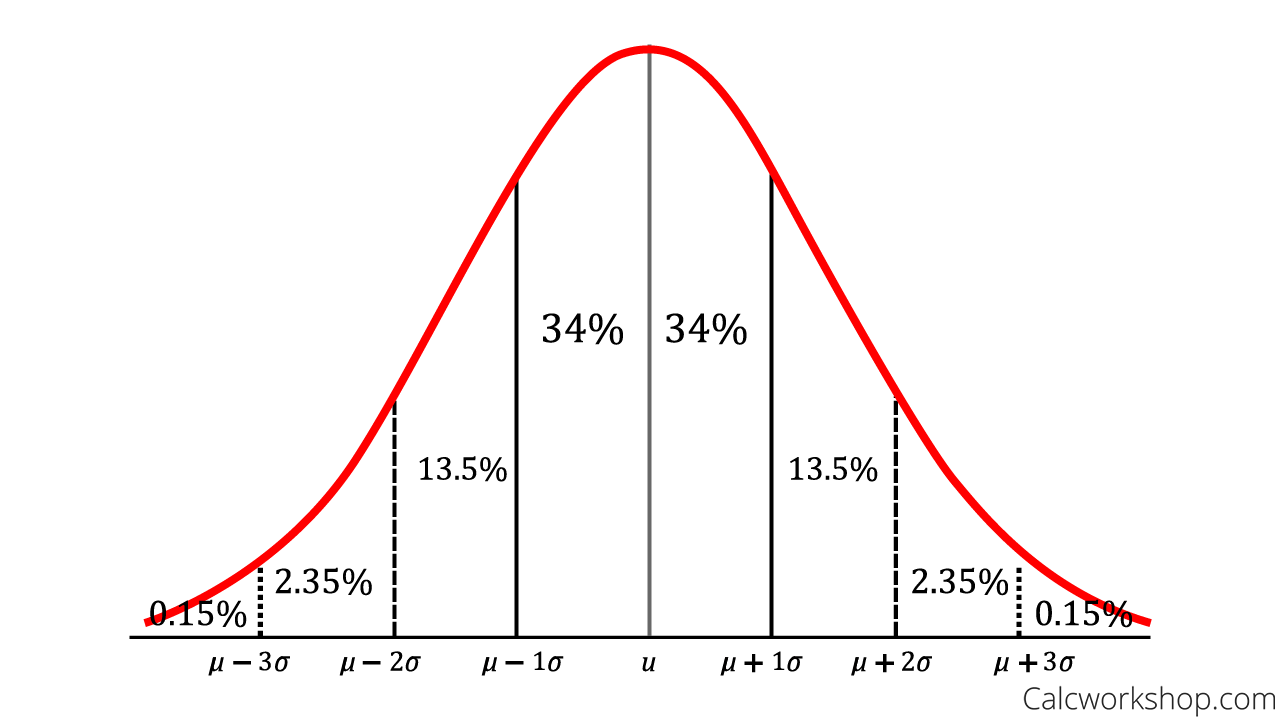
For a given data set with symmetric distribution, that looks like a bell curve, approximately 68% of the observations fall within just one standard deviation of the mean, 95% of the observations fall within two standard deviations of the mean, and 99.7% of observations fall within three standard deviations of the mean.
So the Empirical Rule is the “68-95-99.7” Rule for normal distributions.
Wait! What’s standard deviation?
Standard Deviation measures how data values deviate from the mean, and behaves like a ruler, by measuring how one value compares to the whole.
So if we take the mean (average) and add or subtract the standard deviation to create a normal distribution curve.

Normal Distribution and Standard Deviation
Why do we care?
Because if we know the standard deviation, as Math is Fun so nicely states, we can quickly determine how likely the data will be within 1 standard deviation (68 out of 100), very likely to be within 2 standard deviations (95 out of 100), or almost certainly within 3 standard deviations (997 out of 1000).
This means that if we know that the entire area under a bell curve is 1, or 100%, then the probability that a randomly chosen event will occur is equal to the area under the curve that is subdivided by the standard deviation.
Together we will first learn how to calculate variance and standard deviation for a set of data, and then we will learn how to create normal distribution curves and determine the probabilities of an outcome occurring using the empirical rule.
The Empirical Rule (How-To) – Video
Get access to all the courses and over 450 HD videos with your subscription
Monthly and Yearly Plans Available
Still wondering if CalcWorkshop is right for you?
Take a Tour and find out how a membership can take the struggle out of learning math.