What if I told you that it had been mathematically proven that the orange and red properties in Monopoly by Hasbro are the most profitable (i.e., they are the most landed-on properties)?
Jenn, Founder Calcworkshop®, 15+ Years Experience (Licensed & Certified Teacher)
And when playing the game of RISK, the best strategy for world domination is to attack when you have twice as many armies on a neighboring territory and if the number of troops your opponent has is at most half your own.
How do we know this?
Markov Chains!
Now, we briefly looked at linear difference equations and migration matrices, which lay the foundation of Markov Chains, in our lesson dealing with Applications of Linear Systems and Linear Models in Business. Still, this lesson will dig deeper and allow us to see how Markov Chains, along with stochastic matrices, transition, and migration matrices, help us to study chance processes and give us insight into how the outcome of a given experiment can affect the result of the following experiment.
In fact, modern probability theory studies chance processes (i.e., the likelihood of occurrence) for which the knowledge of previous outcomes influences predictions for future experiments and is used for such things as:
- Predicting the weather conditions given the weather on a preceding day
- A student’s grades based on a sequence of exams in a course
- How population moves or migrates from one place to another
- Classic board games such as Chutes and Ladders, Monopoly, and Risk
Understanding Probability Vectors and Stochastic Matrices
To get a better understanding of all of this, let’s first talk about the fact that a probability vector
How Markov Chains Work
Therefore, a Markov Chain is a sequence of probability vectors,
Thus, a Markov chain is a first-order difference equation representing probabilities and is described as
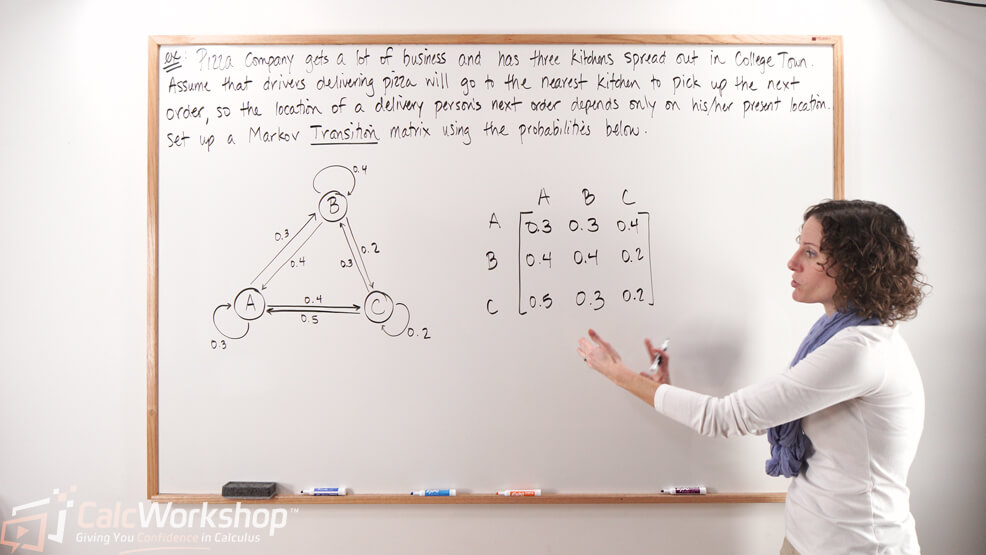
Alright, so let’s practice creating a stochastic matrix
An Example: Predicting Ice Cream Sales
Suppose an ice cream shop offers three flavors: chocolate, strawberry, and vanilla, and is regularly frequented by local customers. In the following directed graph, vertices (nodes) represent the three states (i.e., chocolate, strawberry, and vanilla), and the arrow represents the transition and their probability.
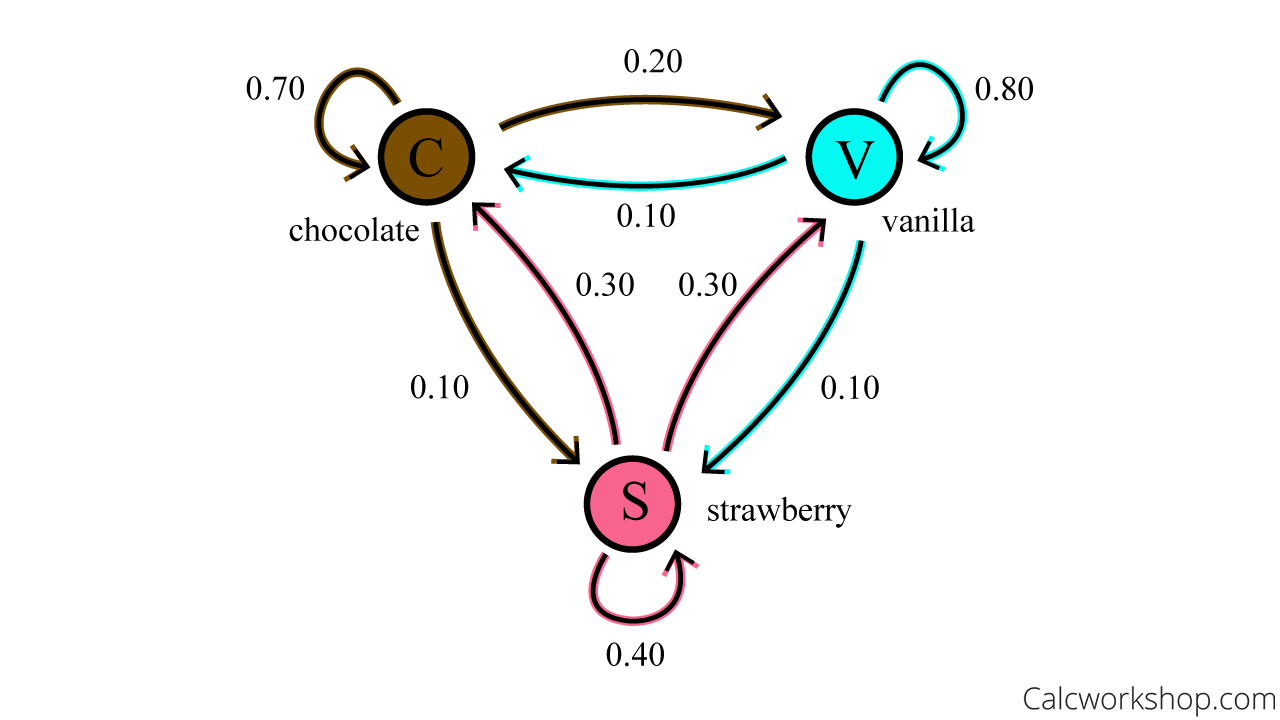
Find Stochastic Matrix (Markov Chain Graph)
The graph above shows that seventy percent of those who ordered a chocolate cone on their last visit will do so again on their next visit. Still, ten percent who previously chose chocolate will choose strawberry next time, and twenty percent will choose vanilla.
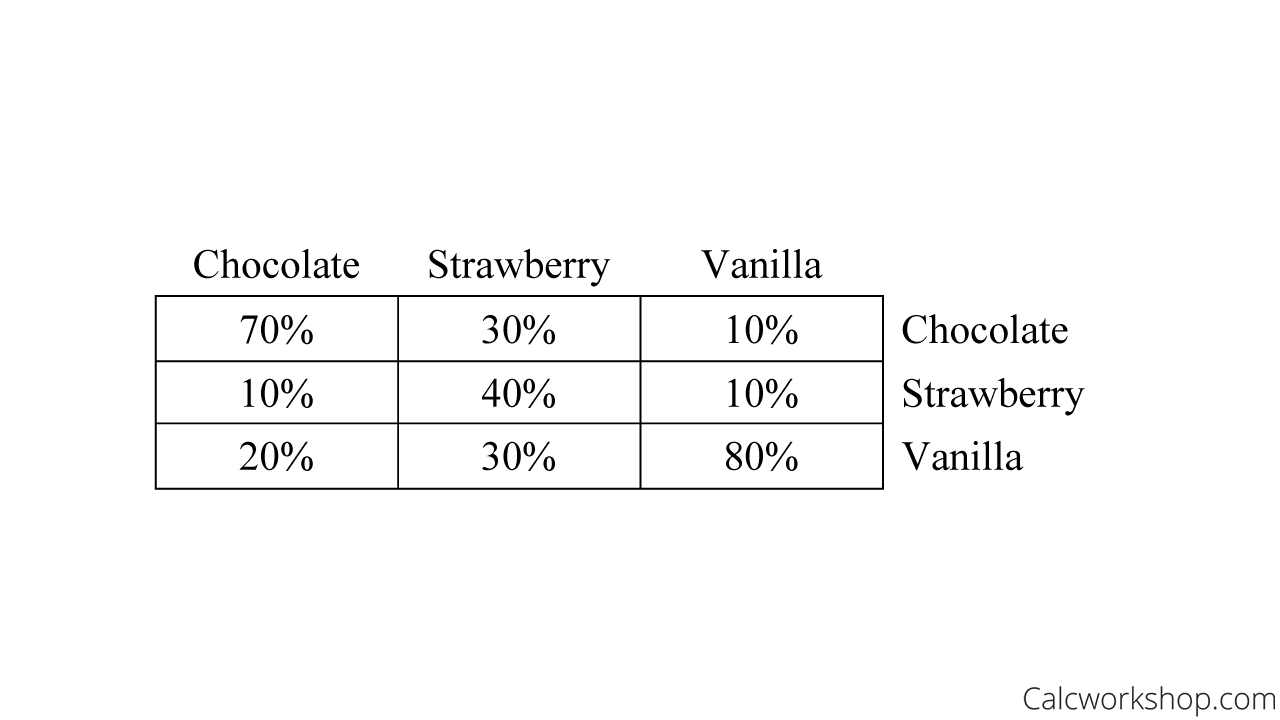
Find Stochastic Matrix (Markov Chain Table)
Using the direct graph, we will make the following stochastic matrix where each column equals 1 and demonstrates the likelihood of a current state (ice cream choice).
Now let us assume that the outcome of today’s ice cream sales shows that
So, using this information, let’s see if we can predict what tomorrow’s ice cream sales are likely to be knowing
This indicates that
But wouldn’t it be really nice if the ice cream shop could accurately predict the likelihood of ice cream choices for its customers? This way, they make enough of the preferred ice cream without having it left over.
From State Vectors to Steady State Vectors
Introducing the steady state vector, sometimes called the equilibrium vector!
The most exciting aspect of Markov Chains is that it does not depend upon which state the chain was in before the current state, and it can accurately predict long-term behavior.
If
But rather than computing numerous iterations of our Markov chain,
This is done by utilizing the following technique:
Thus, we can find the steady state vector for
Calculating the Steady State Vector: A Practical Example
Okay, so using our ice cream shop example, let’s calculate the steady state vector if
First, we find
Now we will augment the matrix with the zero vector and row reduce
Next, we will write our findings in parametric vector form.
Lastly, we will take our solution and make it stochastic. Remember, the sum of the column vector must total 1. Therefore, we will sum the column and divide each entry by that amount.
This yields us a steady-state vector that predicts the future sales of ice cream to be approximately
Next Steps
In this lesson, you will:
- Create stochastic matrices, transition matrices, and migration matrices
- Use the process of Markov chains to predict the future
- Find the steady state vector
Get ready for an exciting experience!
Video Tutorial w/ Full Lesson & Detailed Examples
Get access to all the courses and over 450 HD videos with your subscription
Monthly and Yearly Plans Available
Still wondering if CalcWorkshop is right for you?
Take a Tour and find out how a membership can take the struggle out of learning math.