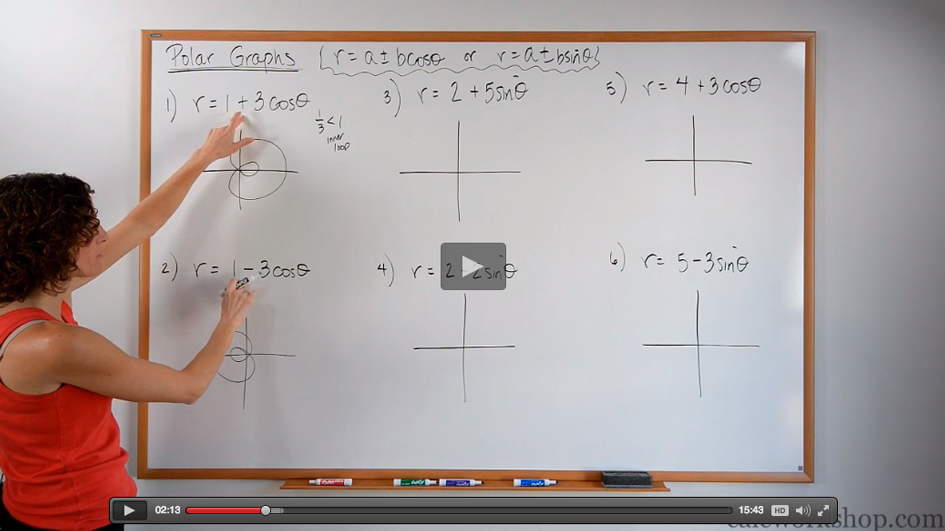
This video lessons explains the Graphing of Polar Curves.

The Spiral of Archimedes
It is going to be extremely important for us to be able to sketch a simple polar curve by hand in order to successfully differentiate and integrate polar functions.
Now, a Polar Graph is one where a set of all points with a given radius and angle that satisfy a Polar Equation
Together we will learn how to graph the five basic Polar Graphs:
- Limacons
- Rose Curves
- Circles
- Lemniscates
- Spirals

Four-leaved Rose Curve
We will use two different methods for graphing each polar equation:
- Transformations
- Table of Values
As you will quickly see, using transformation is easy and straightforward, but there are instances when a more traditional approach, like a table of values, is preferred.

Polar Graph of a Cardiod
Remember, all of these equations involve polar coordinates and all we really have to do to obtain the necessary graph is to just plot points.
Don’t worry!
The more examples we investigate, the easier it will be to recognize patterns and understanding of how the shape of each curve changes based upon the different aspects of its equation.
And you will quickly see that graphing polar curves can be super fun!
Polar Graphs Video

Get access to all the courses and over 450 HD videos with your subscription
Monthly and Yearly Plans Available
Still wondering if CalcWorkshop is right for you?
Take a Tour and find out how a membership can take the struggle out of learning math.