Did you know that we can use a linear regression t-test to test a claim about the population regression line?

Jenn, Founder Calcworkshop®, 15+ Years Experience (Licensed & Certified Teacher)
As we know, a scatterplot helps to demonstrate the relationship between the explanatory (dependent) variable y, and the response (independent) variable x.
And when the relationship is linear we use a least squares regression line to help predict y from x.
But sometimes, we wish to draw inferences about the true regression line.
Recall that a horizontal line has a slope of zero, therefore the y variable doesn’t change when x changes — thus, there is no true relationship between x and y.
So, all we have to do is let our null hypothesis demonstrate a non-straight line relationship (i.e., slope is zero) and our alternative hypothesis asserts that there is a relationship between the explanatory and response variables.
And now all we have to do is test our hypothesis by carrying out a t-test for the slope and the Least Square Regression Line.
But, how do we know when to use inference for regression?
When we desire to answer one the following questions:
- How do we know the strength of the linear relationship between x and y in the population?
- If we estimate a value using a least-squares regression equation, what’s the margin of error?
- How does the sample regression line (estimated regression line) relate to the population regression line (true regression line)?
But, before we can jump into conducting a t-test for slope we first have to check some conditions.
We use the acronym LINEAR!
- Linear: The relationship between x and y is linear.
- Independent: The individual observations are independent.
- Normal: For any fixed value of x, the responses of y varies according to a normal distribution.
- Equal: The variance of y is the same for all values of x.
- And Random: The data is produced from a well-designed, random sample or experiment.
Once we have established the conditions have been met, we are ready to conduct a confidence interval or a hypothesis test. The great thing is that we already know all the steps and procedures for finding confidence intervals and significance tests from our previous units, so this is just an extension of what we already know as outlined by Stat Trek.
Confidence Intervals
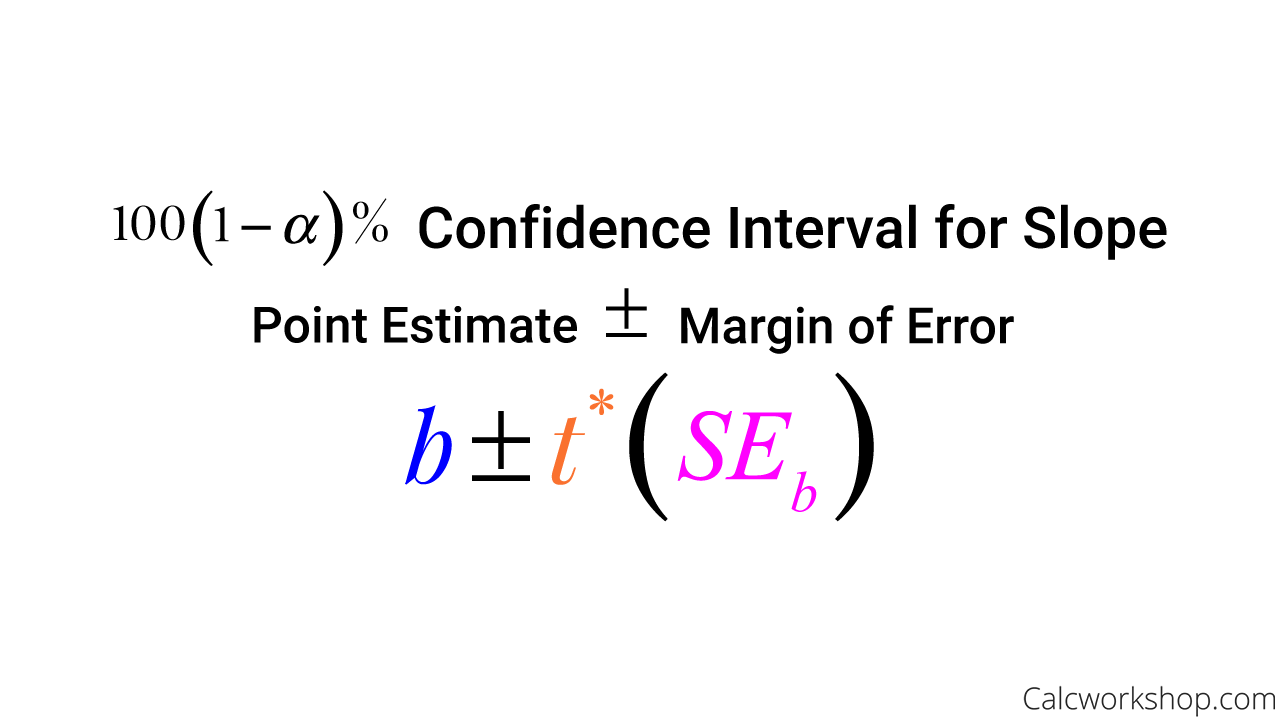
Okay, so for confidence intervals, which are sometimes referred to as prediction intervals, we will use the slope of the regression equation as our point estimate. Then, we will need to determine the margin of error, which is the product of the critical value and the slope’s standard error.
The critical value, or t-interval, is found using a t-distribution with n-2 degrees of freedom. The standard error of the slope is calculated by dividing the standard deviation of the residuals by the square root of the sum of the squares for x.

Confidence Interval For Slope Of Regression Line
Significance Test
Now, if we wish to determine if there is a significant linear relationship between an independent variable x and a dependent variable y, we use a significance test. In other words, we will test a claim about the population regression line because there is a strong correlation observed.
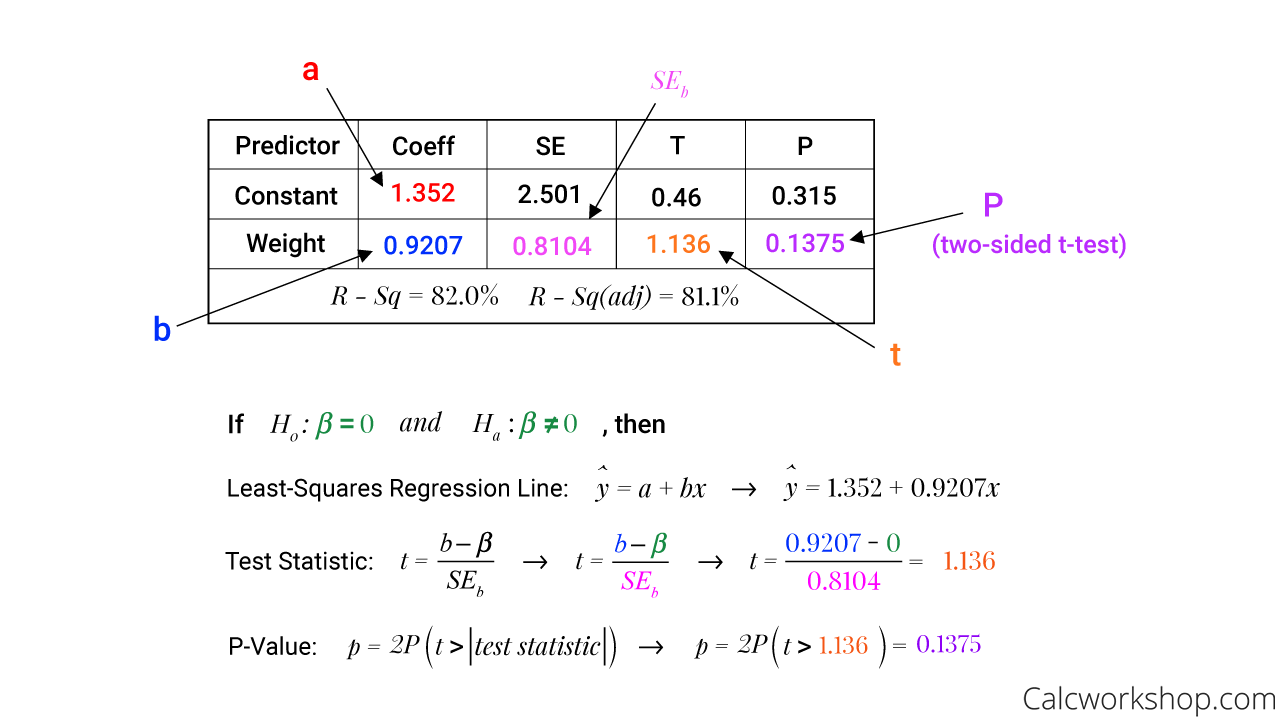
First, we will carry out a t-test for the slope by calculating the p-value and comparing it with the desired significance level.
And then, we will find the p-value by first determining the t-value or test statistic. This number is the ratio of the difference between the statistic and the parameter and the standard deviation of the statistic, keeping in mind that if our p-value is extreme or more extreme than our significance level, we reject the null hypothesis and have significant evidence to conclude the alternative.

How To Interpret P Value In T Test
We will work through how to calculate the confidence interval and draw inferences about the true regression line by using raw data as well as summary statistics and computer output data. And as always, we will ensure that we can calculate the necessary values by hand and with technology.
Together we will use the slope and y-intercept of the least-squares regression to estimate the slope and y-intercept of the population regression line, construct confidence intervals, and use a significance tests for the slope to determine the linear relationship between x and y in the population.
Linear Regression T Test – Lesson & Examples (Video)
1 hr
- Introduction to Video: Significance Test for Slope
- 00:00:49 – Overview and Formulas for conducting Hypothesis testing for Least Squares Regression
- Exclusive Content for Members Only
- 00:11:17 – Estimate the regression line, conduct a confidence interval and test the hypothesis for the given data (Examples #1-2)
- 00:28:30 – Using the data set find the regression line, predict a future value, conduct a confidence interval and test the hypothesis (Examples #3)
- 00:45:09 – Test the claim using computer output data (Example #4)
- 00:51:47 – Write the regression line, test the claim, and conduct a confidence interval using computer output data (Example #5)
- Practice Problems with Step-by-Step Solutions
- Chapter Tests with Video Solutions
Get access to all the courses and over 450 HD videos with your subscription
Monthly and Yearly Plans Available
Still wondering if CalcWorkshop is right for you?
Take a Tour and find out how a membership can take the struggle out of learning math.