Have you ever wanted to find out how well two things work together?
Jenn, Founder Calcworkshop®, 15+ Years Experience (Licensed & Certified Teacher)
I have, and that’s why today we’re going to discuss covariance vs correlation.
Let’s go!
As we know, the mean helps us to describe the center of a probability distribution.
But by itself, it doesn’t give us a full picture of the shape of the distribution.
This is why it is essential to also look at the distribution’s variability to help us understand the dispersion or spread.
Furthermore, the variance of the probability distribution of X is:
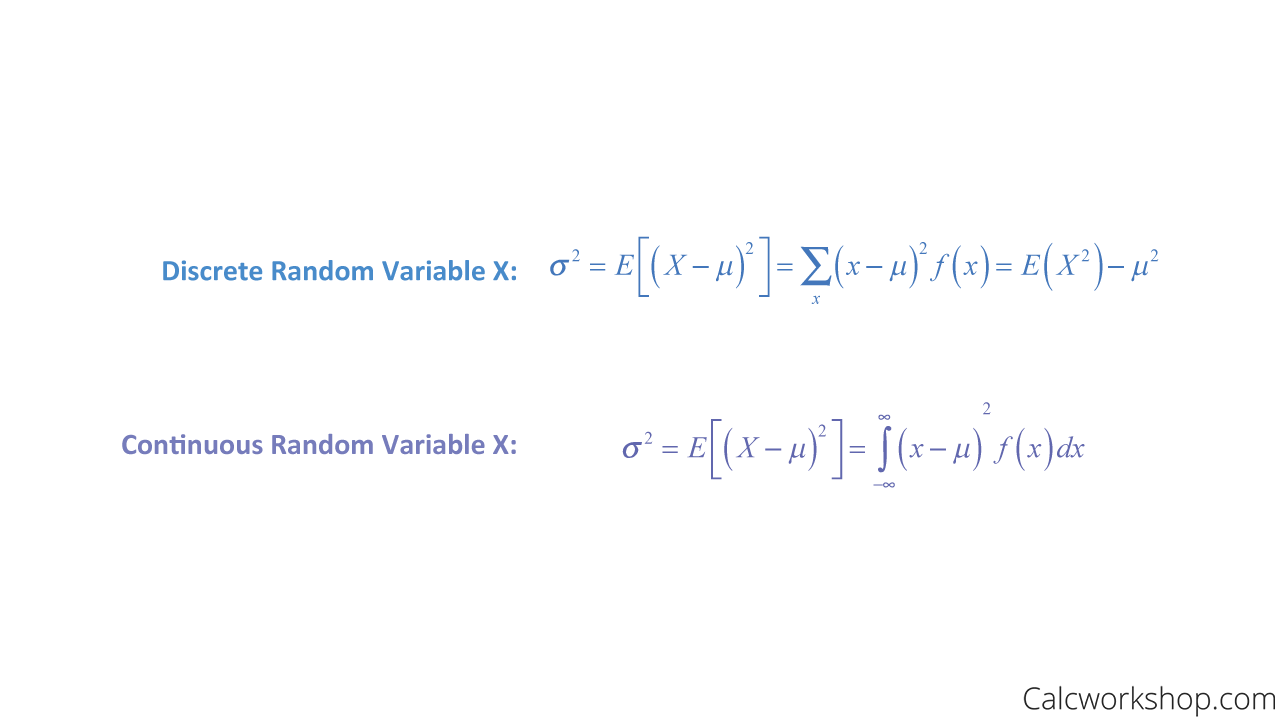
Variance Formula
And this can be also be applied to include random variables related to X.
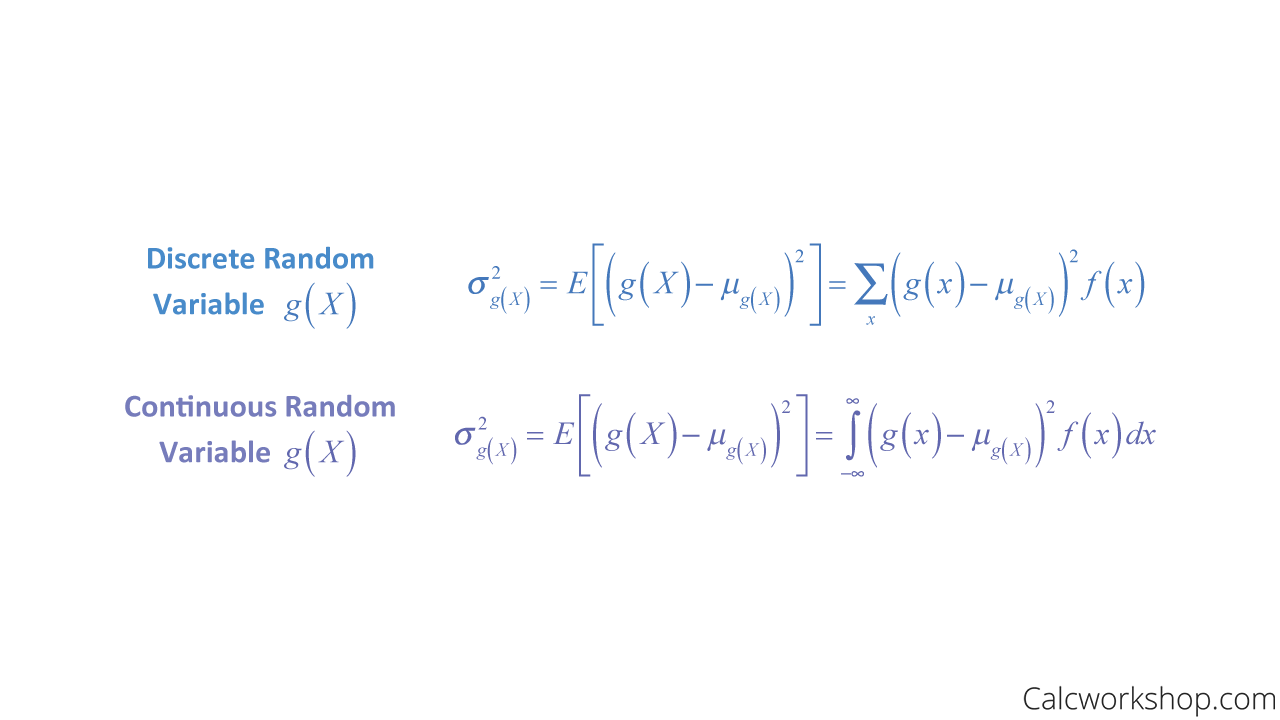
Variance Function
So now, let’s take this knowledge of expectancy and variance for a single random variable and extend it to two random variables.
The covariance between two variables measures the association between them. If large values of X result in large values of Y or small values of X result in small values of Y, then the covariance will tend to be positive. Similarly, if large values of X result in small values of Y, then the covariance tends to be negative, as noted by Towards Data Science.
In other words, the sign of the covariance indicates whether the relationship between the two dependent random variables is positive or negative.
Now, when X and Y are statistically independent, then the covariance is zero. But be warned, the converse is not necessarily true. Just because the covariance is zero doesn’t mean X and Y are independent.
Why?
Because the covariance only describes a linear relationship between X and Y. If the relationship is nonlinear, then the covariance is not a good indicator of association.
Now, if X and Y are random variables with a joint probability distribution, then the covariance of X and Y is:

Covariance Formula
Please note that the Alternate Form, which is the very end of each of the formulas seen above, is the most preferred and effective way of calculating covariance, as it’s the most user-friendly version.
Although the covariance does provide us with information regarding the association between two variables X and Y, it doesn’t tell us much about the strength of their relationship. In other words, it helps us to measure how variables change, or vary, together.
Is there a way to measure the strength of association between two random variables?
Yes!
And the answer lies in finding the correlation coefficient.
The correlation coefficient is a scale-free version of the covariance and helps us measure how closely associated the two random variables are.
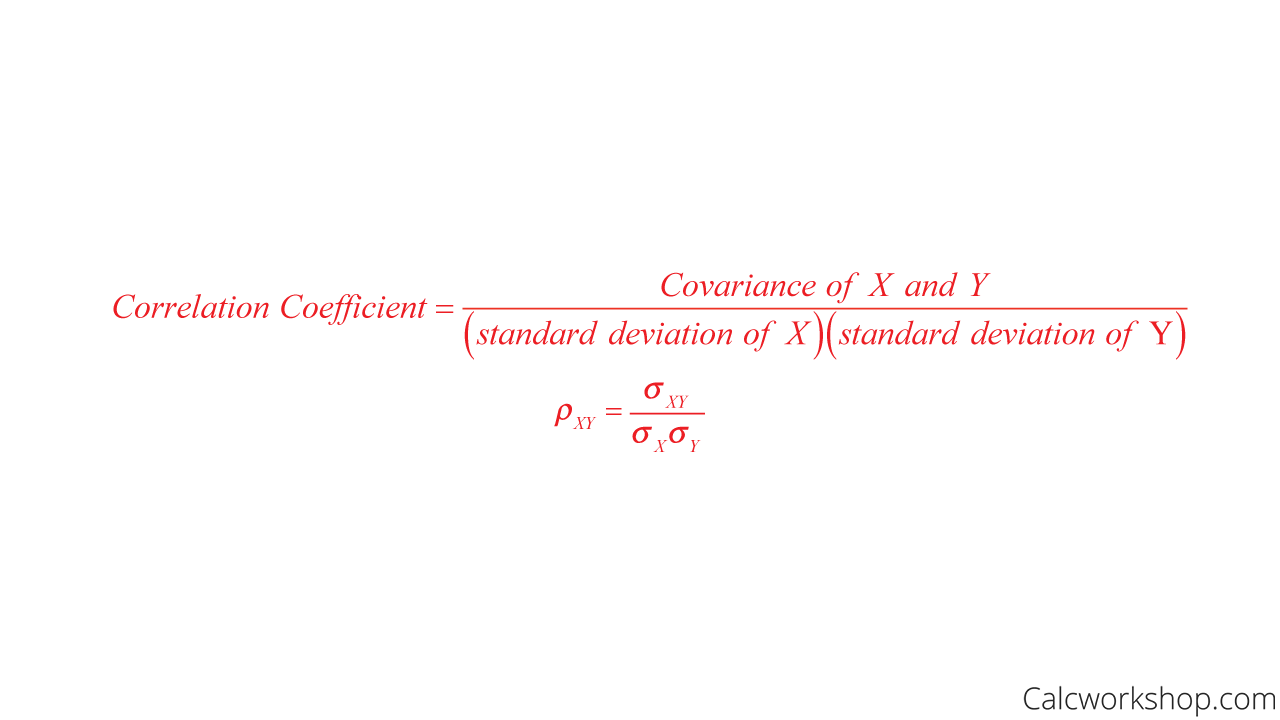
How To Find Correlation Coefficient
Hint: the closer the value is to +1 or -1, the stronger the relationship is between the two random variables.
And as a side note, we can even connect covariance and correlation to vectors in the sense that the correlation coefficient just so happens to correspond to the cosine of the angle between the two random variables X and Y. Cool!
We will also be exploring the notion of covariance and correlation again when we look at least-squares regression and scatterplots. Exciting!
Example
Okay, but how does this look in practice? Let’s look at an example!
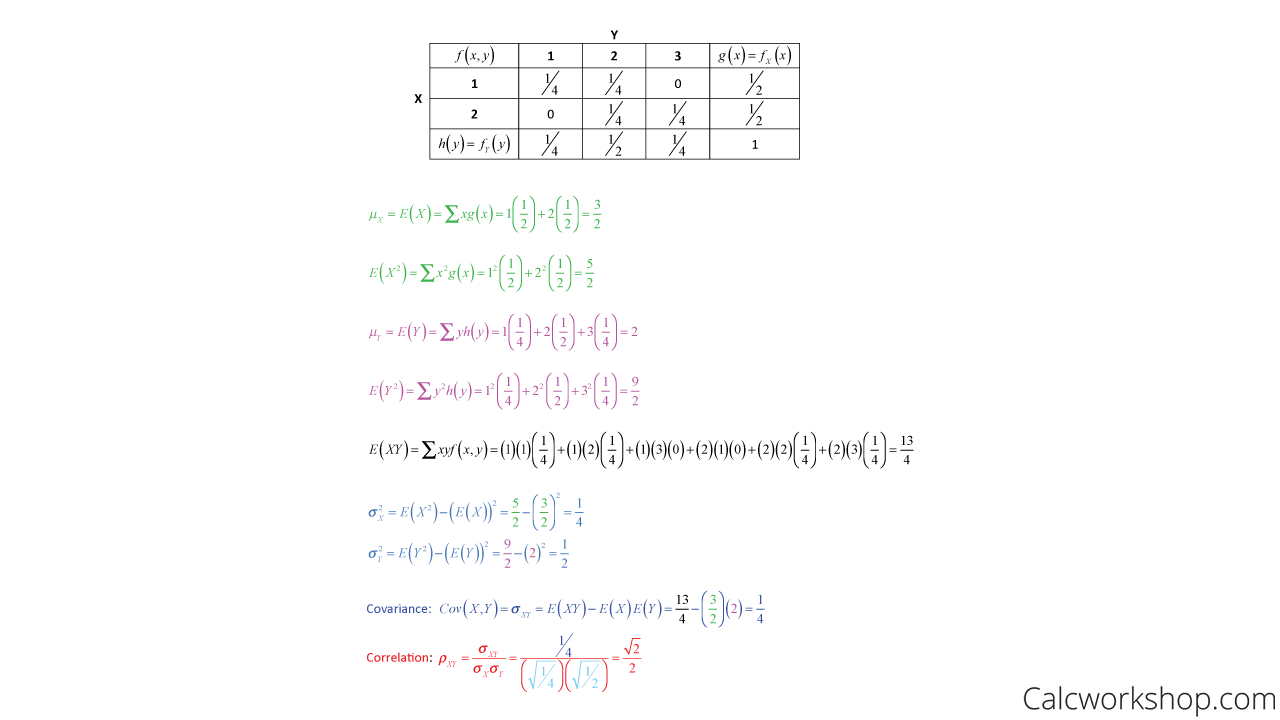
Covariance And Correlation Coefficient Example
We will explore how to find the covariance and correlation coefficient for both discrete and continuous random variables with joint probability distributions throughout the video lesson. You will find that while the formulas are pretty straightforward, they can be a bit tedious in nature, so we will have to keep our wits about us and remember some important integration techniques along the way.
Let’s get after it!
Covariance vs Correlation – Lesson & Examples (Video)
1 hr 29 min
- Introduction to Video: Covariance and Correlation
- 00:00:42 – Review of variance for discrete and continuous random variables with Examples #1-2
- Exclusive Content for Members Only
- 00:19:22 – How do we find covariance?
- 00:22:08 – Find the covariance of two discrete random variables (Example #3)
- 00:30:18 – Find the covariance of two continuous random variables (Example #4)
- 00:41:50 – Determine the covariance and correlation for a joint probability distribution (Example #5)
- 00:57:55 – Find the covariance and correlation given a continuous joint density function (Example #6)
- 01:15:09 – Find the correlation for the joint probability mass function (Example #7)
- Practice Problems with Step-by-Step Solutions
- Chapter Tests with Video Solutions
Get access to all the courses and over 450 HD videos with your subscription
Monthly and Yearly Plans Available
Still wondering if CalcWorkshop is right for you?
Take a Tour and find out how a membership can take the struggle out of learning math.