Did you know that we can consider Chebyshev’s inequality a better version of the Empirical Rule?

Jenn, Founder Calcworkshop®, 15+ Years Experience (Licensed & Certified Teacher)
Why?
Well, as we know, the Empirical rule tells us that almost all data fall within three standard deviations of the mean if we are provided with a Normal distribution.
But what happens if our distribution is skewed?
We use Chebyshev’s inequality because it can be to any data set and a wide range of probability distributions, not just normal or bell-shaped curves!
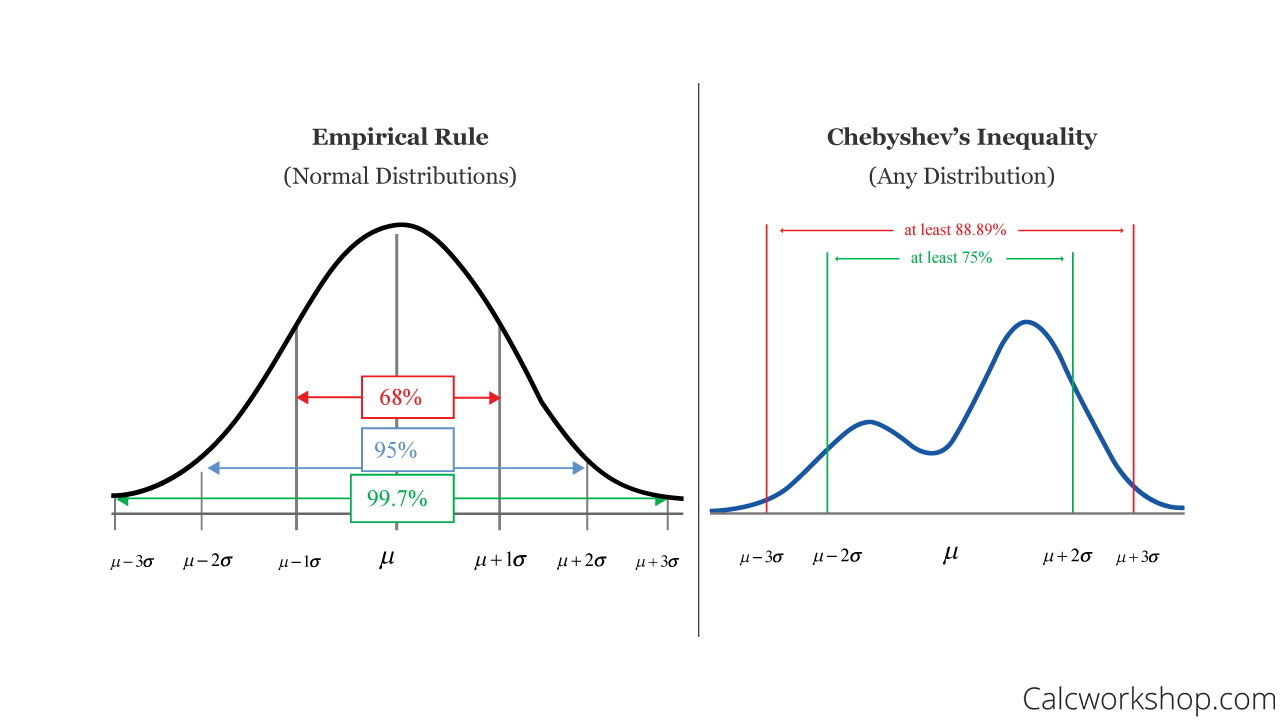
Empirical Rule Vs Chebyshev’s Theorem
So how does it work?
Well, Chebyshev’s inequality, also sometimes spelled Tchebysheff’s inequality, states that only a certain percentage of observations can be more than a certain distance from the mean and hinges on our understanding of variability as discussed in this Stanford writeup.
What we have learned so far is that the variance of random variables tells us a lot about the variability of observations about the mean, because if a random variable has a small variance (i.e., slight standard deviation), then most of the observed values will be grouped close to the mean. By this definition, if the distribution has a large variance, then the observations will be more spread out and further away from the mean.
Additionally, this implies that if the variability is small, then the probability that a random variable assumes a value within a specific interval about the mean is higher than with a random variable with more considerable variability.
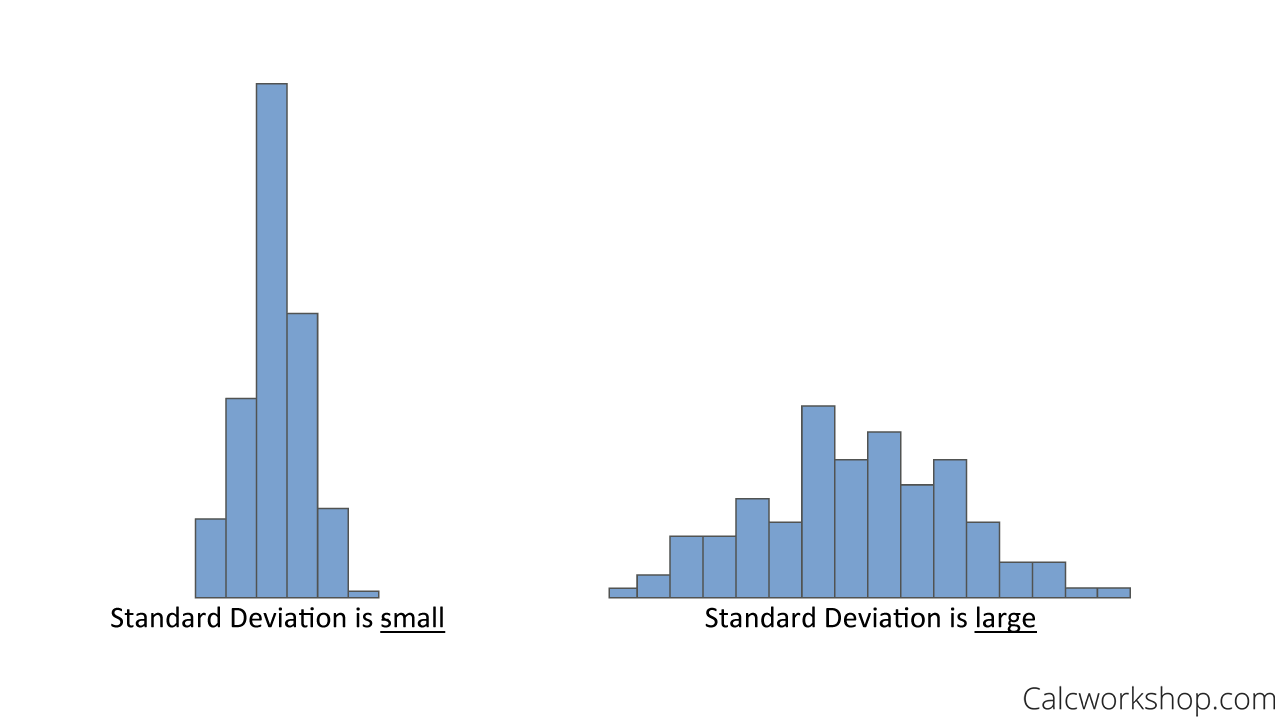
Small Vs Large Standard Deviation
Why is this useful?
Think of probability in terms of area under the curve. The smaller the standard deviation, the smaller the area close to the mean, and the larger the standard deviation, then the more extensive the area. If the fraction of the area between any two values that are symmetric about the mean equals the probability of the random variable assuming a value between these two numbers.
And using this idea, we can create a conservative estimate of the probability that a random variable assumes a value within a specified standard deviation of its mean. In other words, it’s an interval that yields the minimum proportion of data that must lie within a given number of standard deviations of the mean.
This is why, using Chebyshev’s inequality, we can state that about 75% of observations will fall with two standard deviations of the mean.
Chebyshev’s Theorem states:
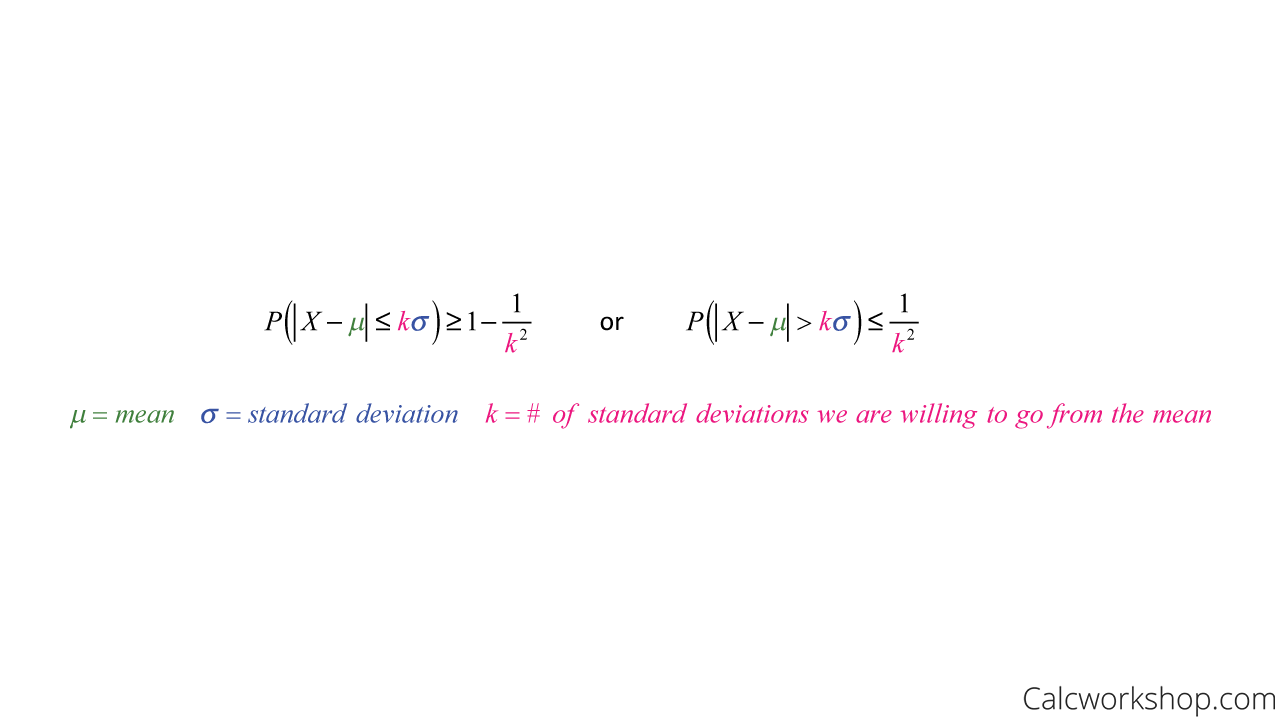
Chebyshev’s Inequality Formula
Remember, Chebyshev’s inequality implies that it is unlikely that a random variable will be far from the mean. Hence, our k-value is our limit that we set, stating the number of standard deviations we are willing to go away from the mean.
Example
So now let’s look at an example. Suppose 1,000 applicants show up for a job interview, but there are only 70 positions available. To select the best 70 people amongst the 1,000 applicants, the employer gives an aptitude test to judge their abilities. The mean score on the test is 60, with a standard deviation of 6. If an applicant scores an 84, can they assume they are getting a job?
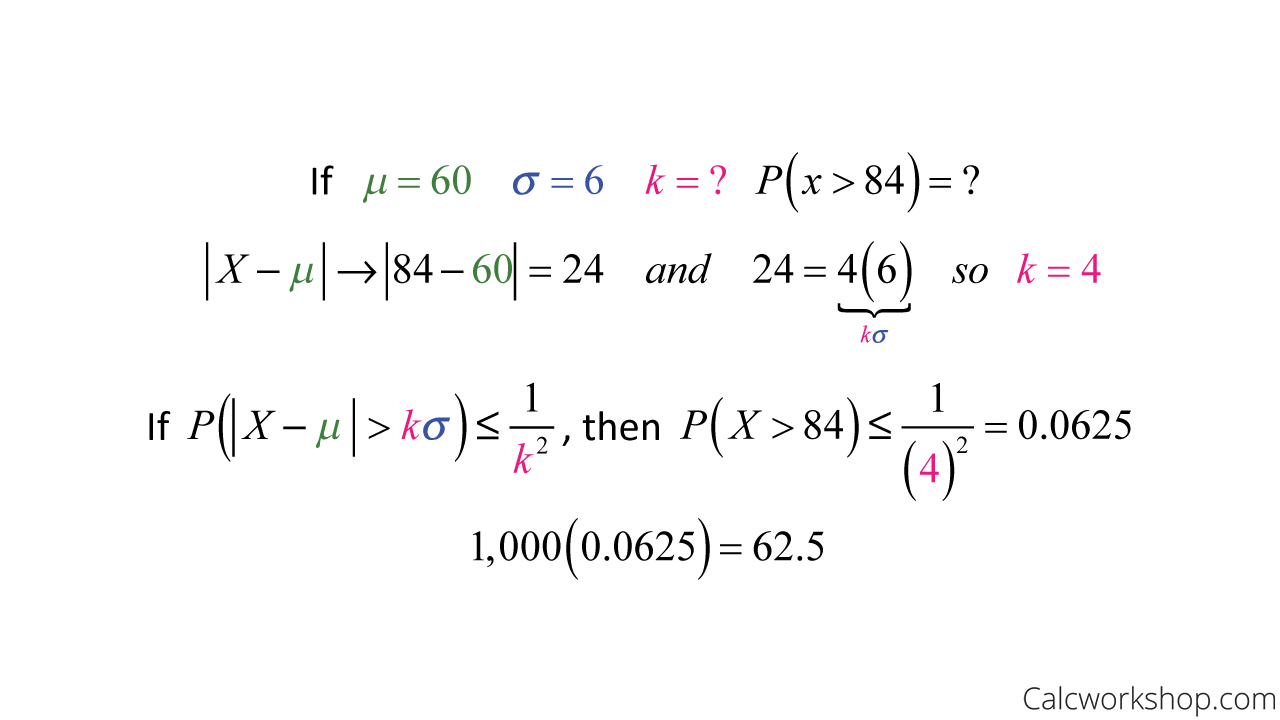
Chebyshev’s Inequality Example
Our results show that about 63 people scored above a 60, so with 70 positions available, an applicant who scores an 84 can be assured they got the job.
Together, we work through several examples for how we set up Chebyshev’s inequality, find our k-value, and determine a conservative estimate for probability.
Chebyshev Inequality – Lesson & Examples (Video)
58 min
- Introduction to Video: Chebyshevs Inequality
- 00:00:51 – What is Chebyshev’s Theorem? with Example #1
- Exclusive Content for Members Only
- 00:17:58 – Use Tchebysheff’s inequality to approximate the probability (Examples #2-3)
- 00:32:43 – Find the probability using Chebyshev’s inequality (Examples #4-5)
- 00:45:53 – Show the accuracy of Chebyshev’s Theorem (Example #6)
- Practice Problems with Step-by-Step Solutions
- Chapter Tests with Video Solutions
Get access to all the courses and over 450 HD videos with your subscription
Monthly and Yearly Plans Available
Still wondering if CalcWorkshop is right for you?
Take a Tour and find out how a membership can take the struggle out of learning math.