When to use chi square test?

Jenn, Founder Calcworkshop®, 15+ Years Experience (Licensed & Certified Teacher)
Great question, however before we talk about when to use it, we need to discuss the 3 different types of significance tests available.
- Goodness Of Fit Test
- Independence
- Homogeneity
So, a chi square test can be used to find out how our observed value is significantly different from our expected value (goodness of fit). Whereas, chi square test for independence and homogeneity are concerned with whether one attribute is independent of the other or whether two or more subgroups share the same distribution of a single categorical variable.
So let’s jump in!
What happens if we want to find inferences about categorical data rather than quantitative data?
We apply a Chi-Square analysis.
We calculate the sum of the weighted differences between what we observe and what we expect relative to the magnitude of the expected value.
But the real beauty of Chi-Square tests is that we are allowed to consider experiments with multiple outcomes.
Real Life Examples
For example, imagine we are a candy store manager in charge of stocking shelves, and we want to make sure that we have the candy that is in demand.
We can apply a chi-square test to determine which type of candy is most popular and make sure that our shelves are well stocked. Or maybe you’re a scientist studying the offspring of cats to determine the likelihood of certain genetic traits being passed to a litter of kittens.
What is important to note is that the distribution of the chi-square statistic is called the chi-square distribution, which is a right-skewed distribution, but as the degrees of freedom increase, the curve becomes more normally distributed.
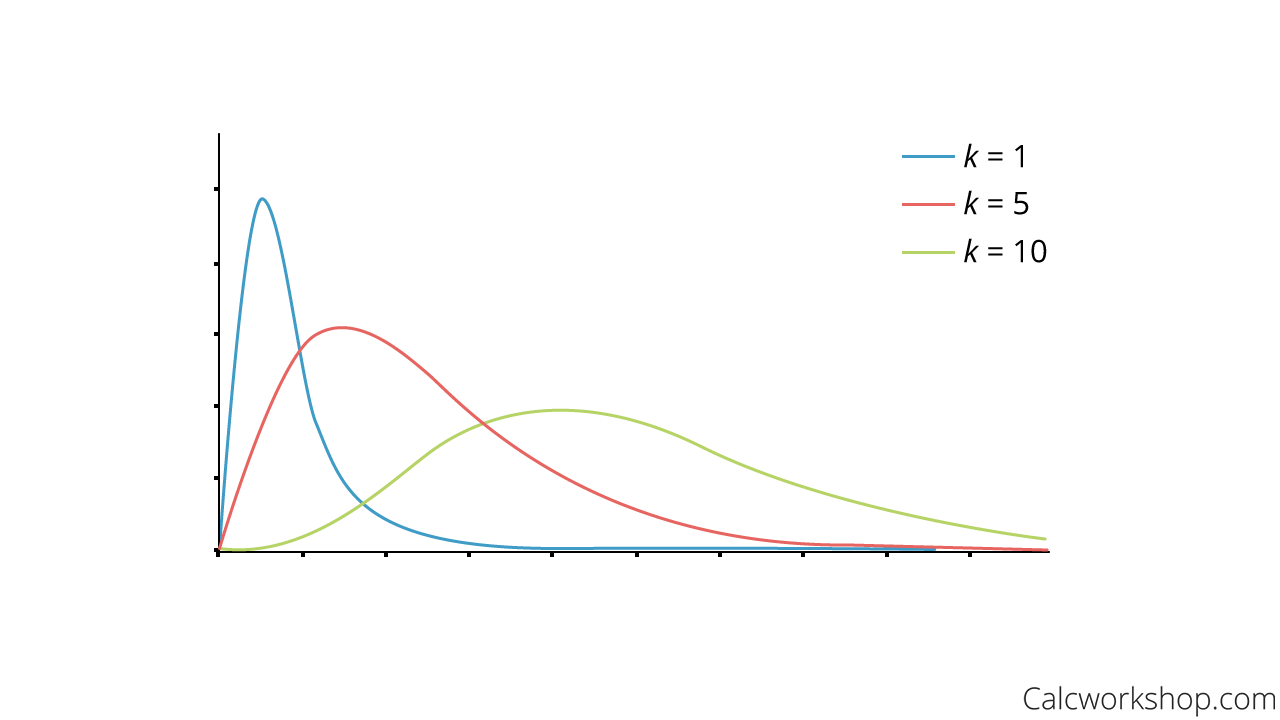
Chi Square Distribution Graph
Chi Square Goodness Of Fit
Now chi-square goodness of fit test is used to determine how far away our observed results are from what we initially expected. We do this by analyzing the frequencies of occurrences (counts) in an observed sample and the expected frequencies from either a hypothesized distribution or a previously known probability distribution as discussed by City University of New York.
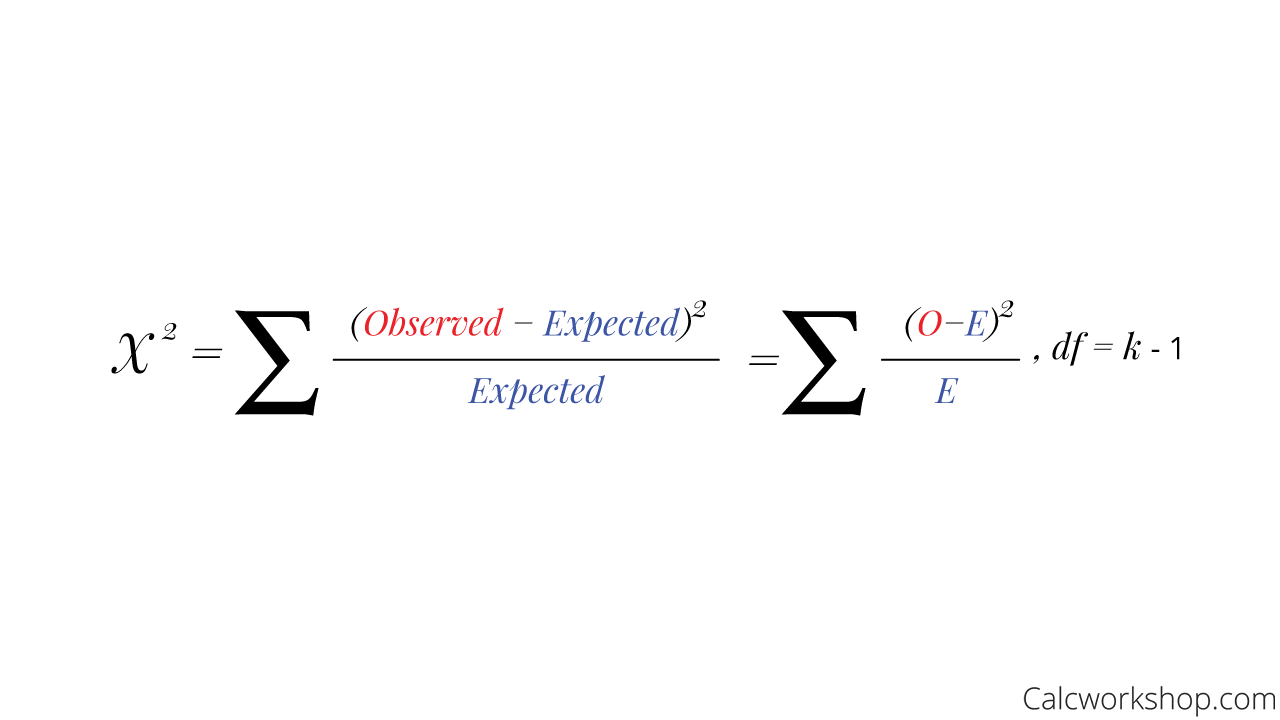
Goodness of Fit Formula
And, most importantly, the Goodness of Fit test can be applied to frequency tables, also known as a contingency table!
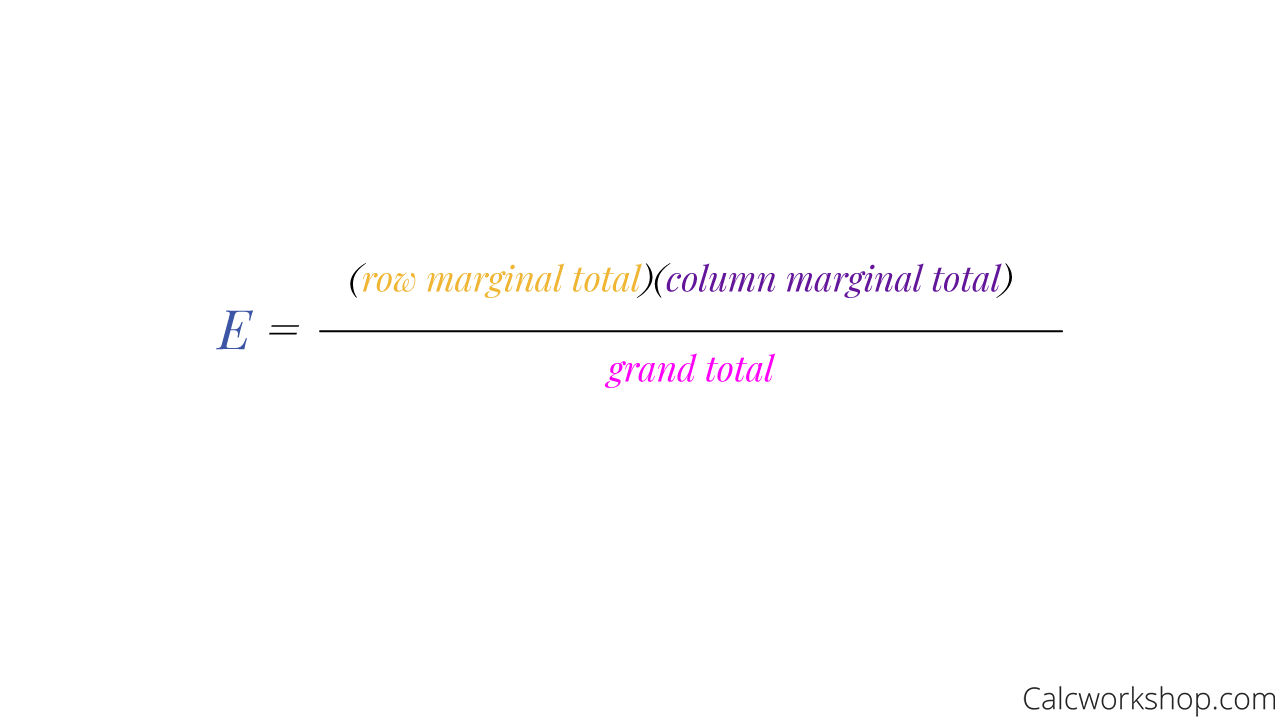
Expected Value Formula
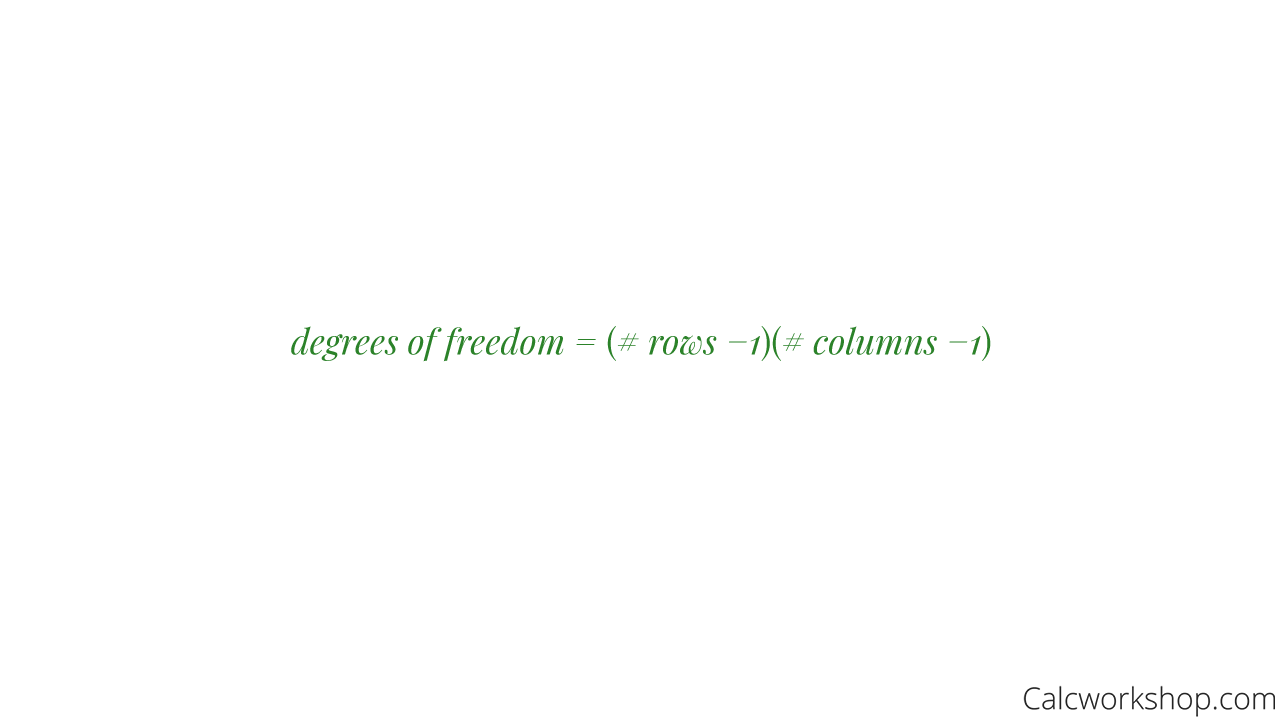
Degrees Of Freedom With Respect To Tables
We perform this test by:
- Stating the null and alternative hypotheses.
- Calculating a chi-square test statistic.
- Comparing the test statistic value to a critical value determined from the chi-square table or by finding the p-value using technology.
Additionally, the chi-square test can also be applied to independence and homogeneity.
When one event has no effect on the occurrence of another event, we say that the two events are independent. The chi-square independence test helps us determine association or dependence. For example:
- Is there an association between gender and political preferences?
- Or what effect does age have on movie choices?
Chi Square Example
The test utilizes the chi-square distribution, where the null hypothesis declares no association between the two variables (independence) and the alternative being dependent, as the example below illustrates.
Suppose we wish to determine if there is a relationship between a voter’s opinion concerning a new tax reform bill and their level of income. The example below highlights how we use the chi-square test to determine association.
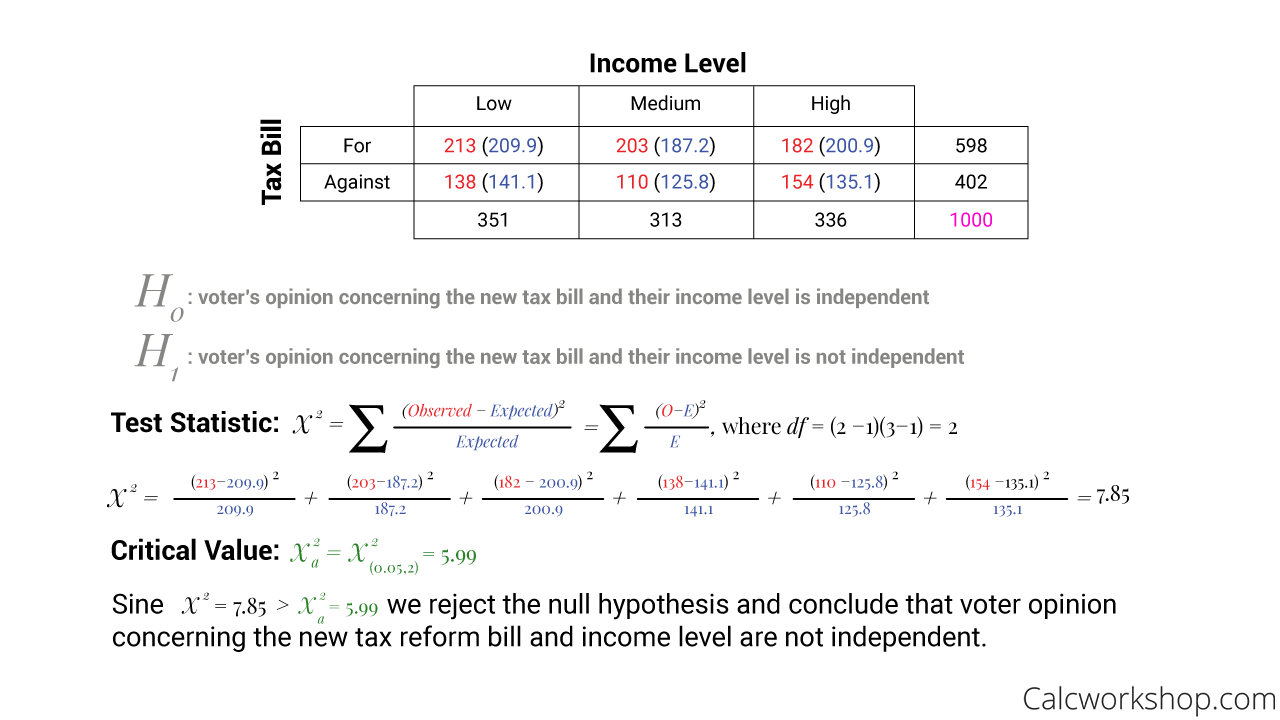
Chi Square Test of Independence Example
Likewise, we can use the chi-square test for homogeneity of proportions to see if different populations have the same proportion of individuals with similar characteristics. For example:
- Does steroid use by student-athletes differ for the three NCAA divisions?
- Is the distribution of living arrangements (dorm, apartment, other) for male and female college students the same?
These types of questions ask us to determine whether the population proportions are the same or different.
Again, just like the goodness of fit and test for independence, we use the same analysis for the chi-squared statistics as before where the only change is that our null hypothesis states the proportions are the same (homogeneous) against the alternative that the proportions are not the same (inhomogeneous).
Together we will look at how to use the Chi-Square distribution table, as well as technology, as we seek to determine:
- Whether a frequency distribution fits an expected distribution.
- Whether the occurrences of one variable affects the probability of the occurrence of another.
- And if different populations have the same proportions.
Chi Square Test – Lesson & Examples (Video)
1 hr 34 min
- Introduction to Video: Chi-Square Goodness of Fit
- 00:00:43 – Overview of the Chi-Square Distribution and Goodness of Fit Test
- Exclusive Content for Members Only
- 00:12:07 – Use the Chi Square Goodness-of-fit Test to determine if observed frequencies match expected frequencies (Examples #1-2)
- 00:30:29 – Determine if observed frequencies match expected frequencies using Chi-Square Goodness of fit test (Examples #1-2)
- 00:45:21 – Chi Square Test explained for Independence with (Example #5)
- 00:58:35 – Test for independence (Example #6)
- 01:06:50 – Overview of the Chi Square Test for Homogeneity (Example #7)
- 01:17:35 – Determine if the population proportions are homogeneous (Example #8)
- Practice Problems with Step-by-Step Solutions
- Chapter Tests with Video Solutions
Get access to all the courses and over 450 HD videos with your subscription
Monthly and Yearly Plans Available
Still wondering if CalcWorkshop is right for you?
Take a Tour and find out how a membership can take the struggle out of learning math.