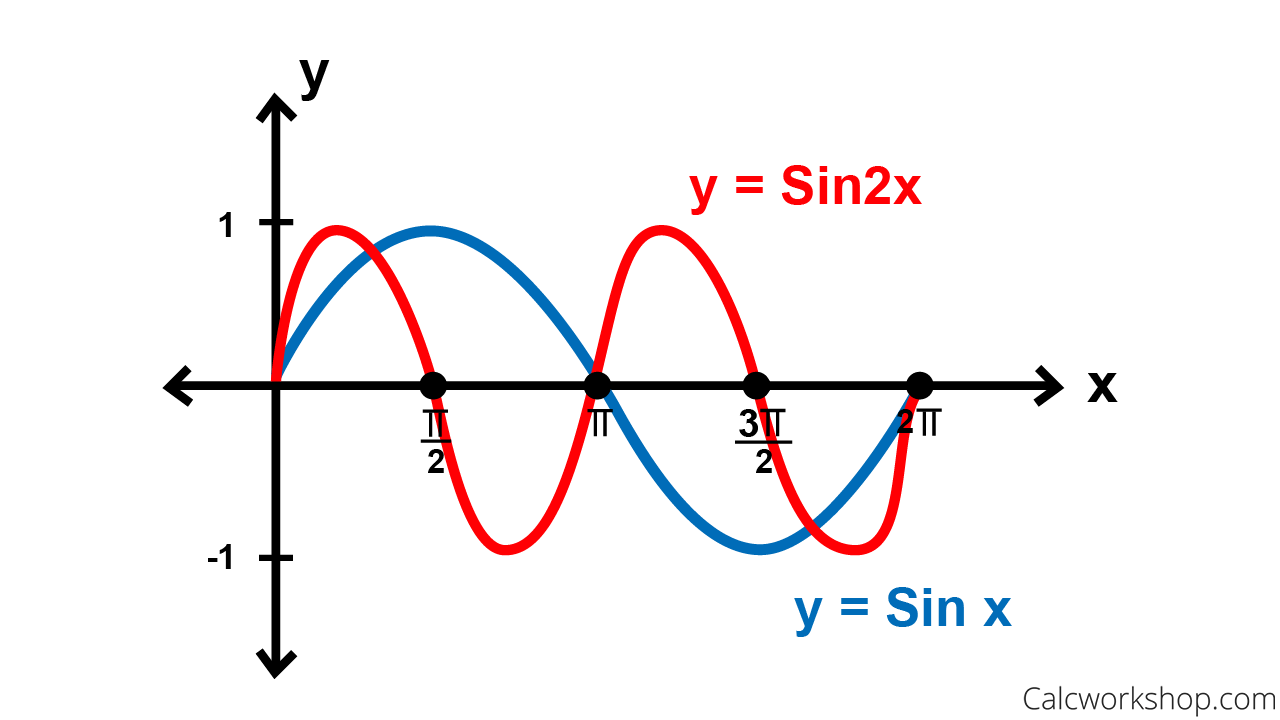
Now that we are champions at unwrapping our basic trigonometric functions, sine and cosine, and seeing how they are graphed on the x-y-plane, we are now going to learn how to Graph Sine and Cosine with a Period Change.

As we already know, for periodic functions the term period stands for the horizontal length of one complete cycle or wave before it repeats, as nicely stated by PurpleMath.
We also know that we can graph one complete wave or cycle by the time we rotate once around our unit circle.
But what would happen if we gave our Sin or Cos function a lot of caffeine? What would happen?
Well, if you’re anything like me, then we should expect to see some hyperactivity, right?
By changing “B” we can dictate how fast we want our function to complete a wave/cycle. In other words, if B = 1, we know that we will see one complete wave by the time we rotate once around the unit circle. But, if B=2, then that means we will make our function twice as fast and we will see two complete waves/cycles by the time we rotate around our unit circle!
Cool!

Period Change for Sine
But, what happens if we’re not in a hyper mood, and we’re tired and want to rest? Don’t worry, the sine and cosine function totally understand this too.
Instead of speeding our function up, we can also slow it down, again all we have to do is change B.
In other words, B measures the time it takes (how fast or slow) for our function to complete a full wave/cycle, as nicely stated by Khan Academy
So in this lesson we are going to change the period of our sine and cosine functions and see how it stretches or compresses. In doing so, will walk through multiple examples to demonstrate how to expand (slower oscillation) or compress (faster oscillation), until we have mastered our new found skill.
Graphing Sin & Cos (w/ Period Change) – Video
Get access to all the courses and over 450 HD videos with your subscription
Monthly and Yearly Plans Available
Still wondering if CalcWorkshop is right for you?
Take a Tour and find out how a membership can take the struggle out of learning math.