Which is better for measuring the center? Mean, median, mode, or standard deviation?

Jenn, Founder Calcworkshop®, 15+ Years Experience (Licensed & Certified Teacher)
That’s one of the many questions we’re going to ask in this lesson, as we seek to discover how to measure the center and spread of a distribution.
Mean
Now, the mean, sometimes called the arithmetic mean, is the average or the expected value that measures the central value of a data set.
It is found by adding all of the values in the data set and dividing it by the number of values.
While there are several types of means that we will learn about in probability and statistics, the two most important are the population mean and the sample mean.
The sample mean is the average of the values collected, whereas the population mean is the average of all the values in the population.
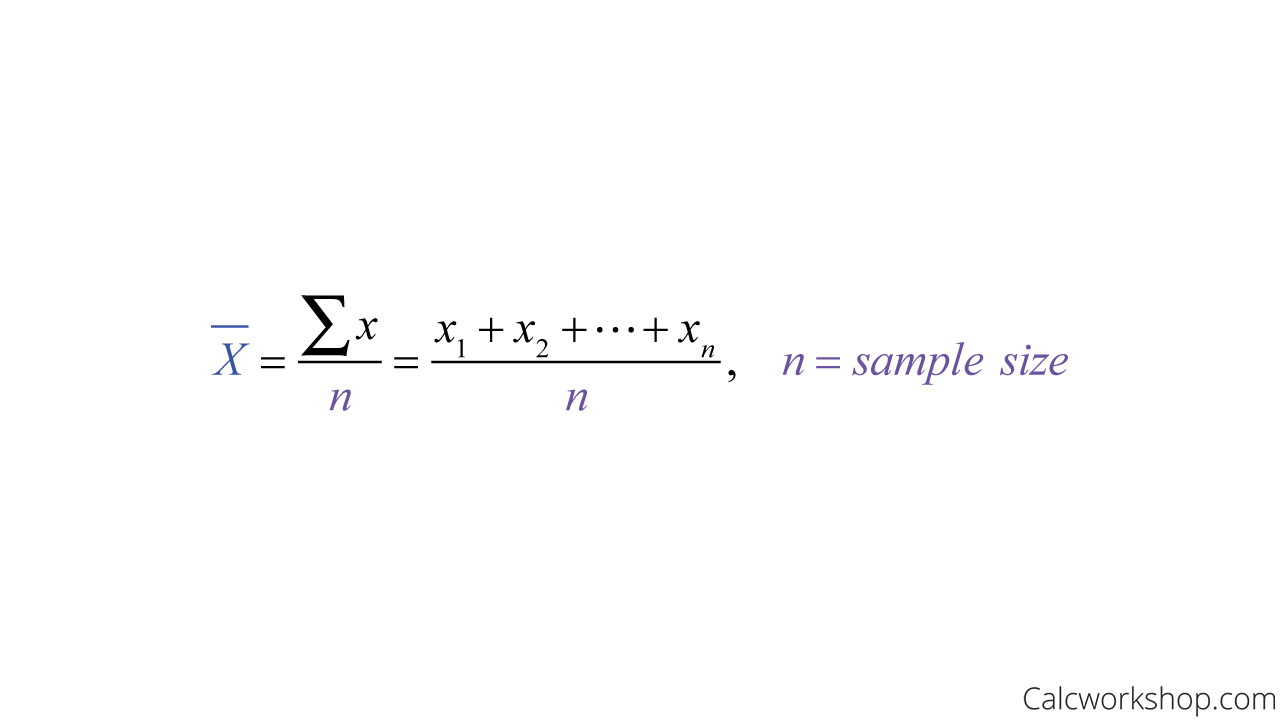
Sample Mean Formula
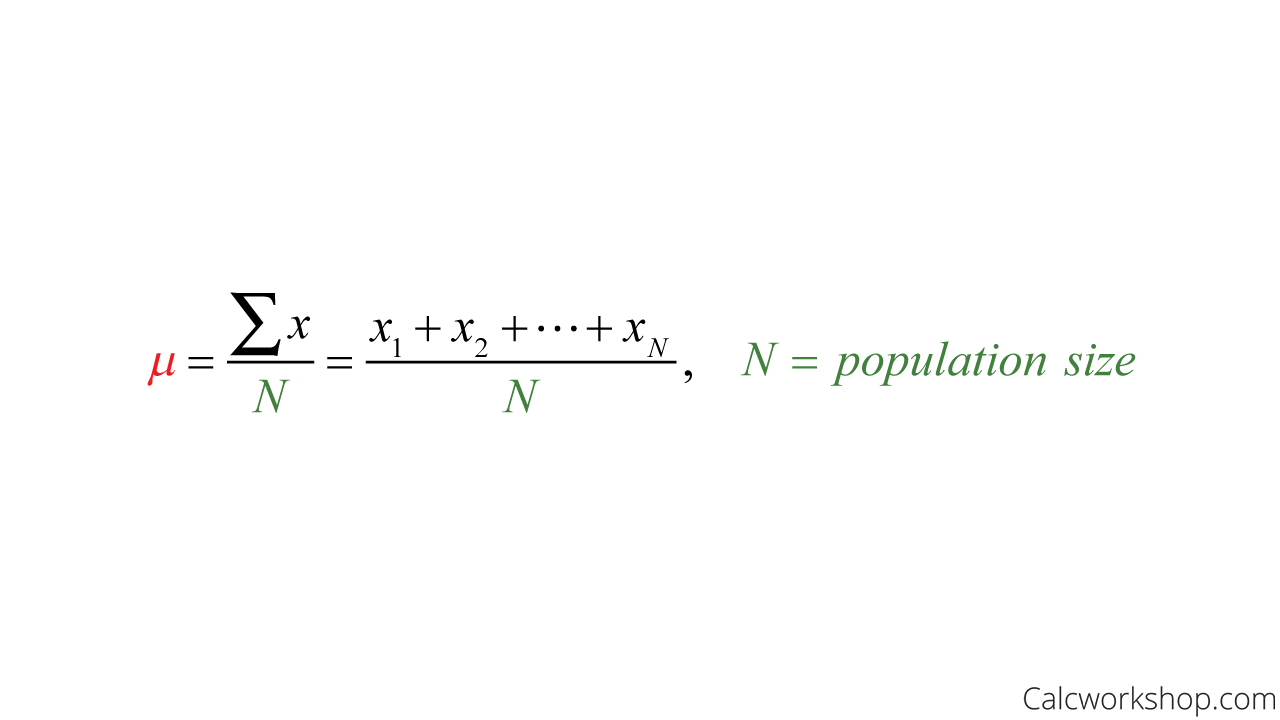
Population Mean Formula
Realistically, the population mean is hard to calculate, so if size of our sample is large enough , the mean becomes a reasonable estimate for the population.
Median
The median is the middle term, or number in a data set ranked in ascending (increasing) order. In other words, it separates the lower half of the data set from the upper half.
What’s important to note is that if the data set has an odd number of values, the median is the middle number. But if the data set has an even number of values, then the median is the average of the two middle terms as Monterey Institute points out, and as the following examples demonstrate.

Median Of Even Set
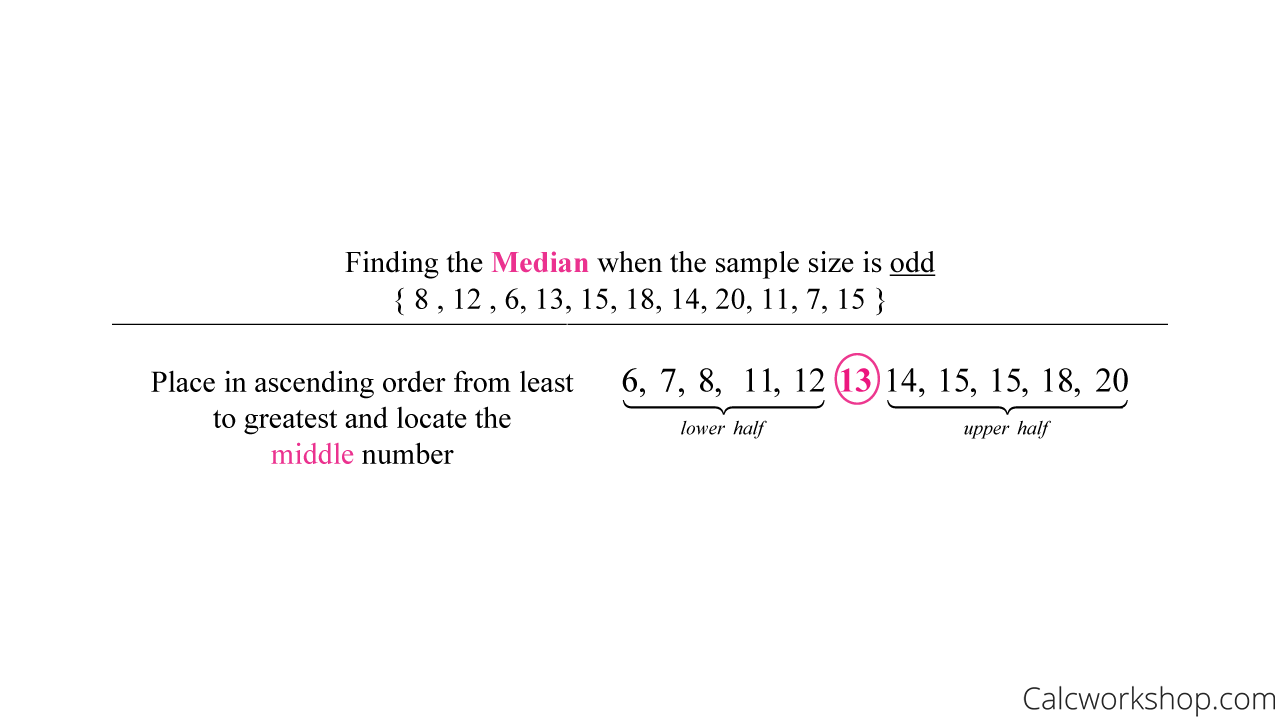
Median Of Odd Numbers
Mode
The mode is the value that occurs most frequently in the data set and is considered the most popular number or term. If the data set is unimodal, there will be one mode, but if the data set is bimodal or multimodal, there were will two modes or many modes, respectively.
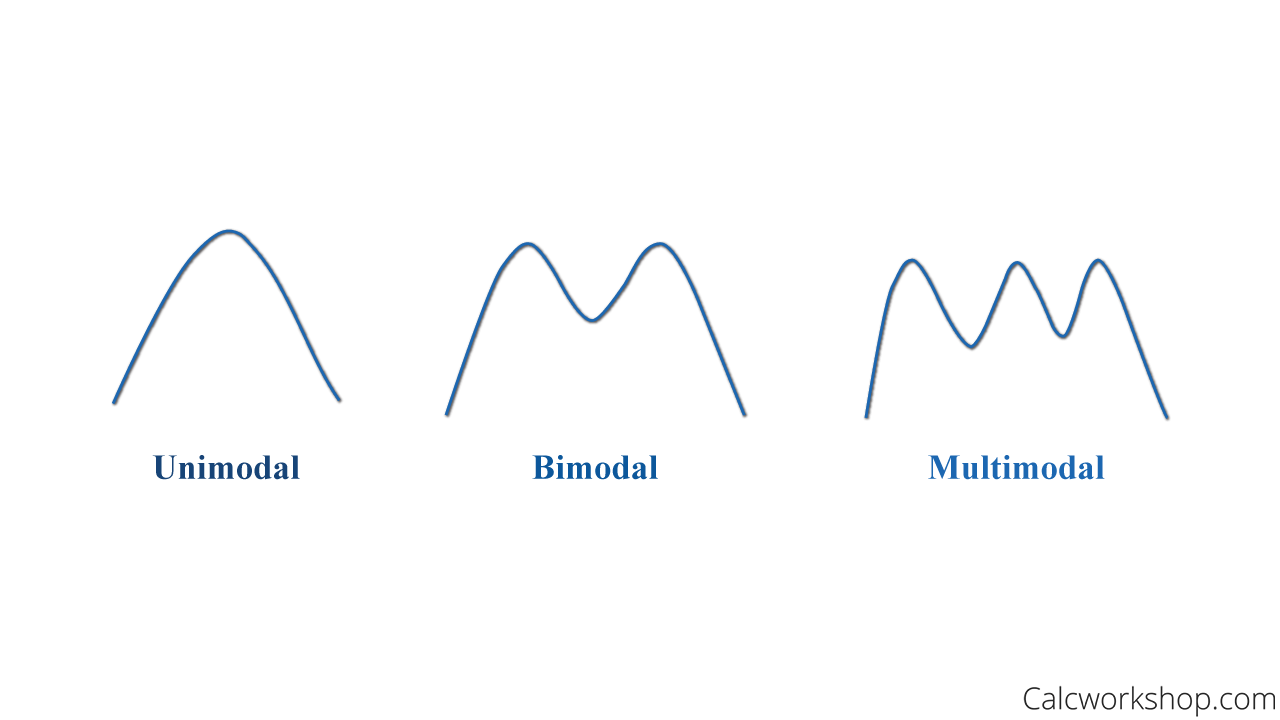
Unimodal, Bimodal, and Multimodal
Range
Another important value that helps us to understand the center and spread of a distribution is the range. The range is the difference between the maximum value and the minimum value. It’s nothing more than taking the biggest number and then subtracting the smallest number. It gives us a sense of where all the data values exist.
If we have the following data set { 8, 12, 6, 13, 15, 18, 14, 20, 11, 7, 15 }, what do we know?
We know the mode is 15 because it occurs most often, and the range is 14 as it is the value found when we subtract the biggest number, 20, and the smallest number, 6.
Additionally, we can find the Interquartile Range (IQR), which measures the middle 50% of the data and finds the difference between the first and third quartiles. And if you recall, quartiles are the values that divide a dataset into quarters, meaning 25% of the values are below the first quartile, and 75% of the values are below the third quartile, as the example below illustrates.
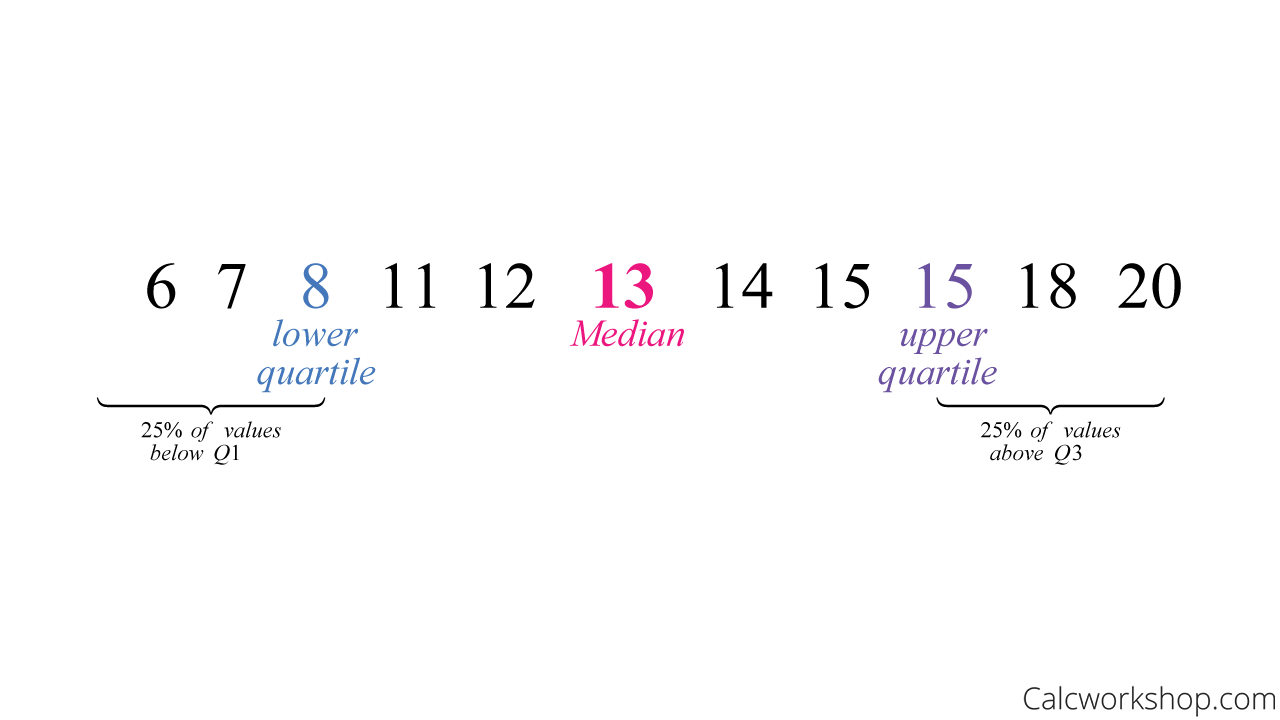
How To Find IQR
So, the IQR is the difference between the upper quartile (Quartile 3) and the lower quartile (Quartile 1), and by using the example above we find that the interquartile range for this dataset is
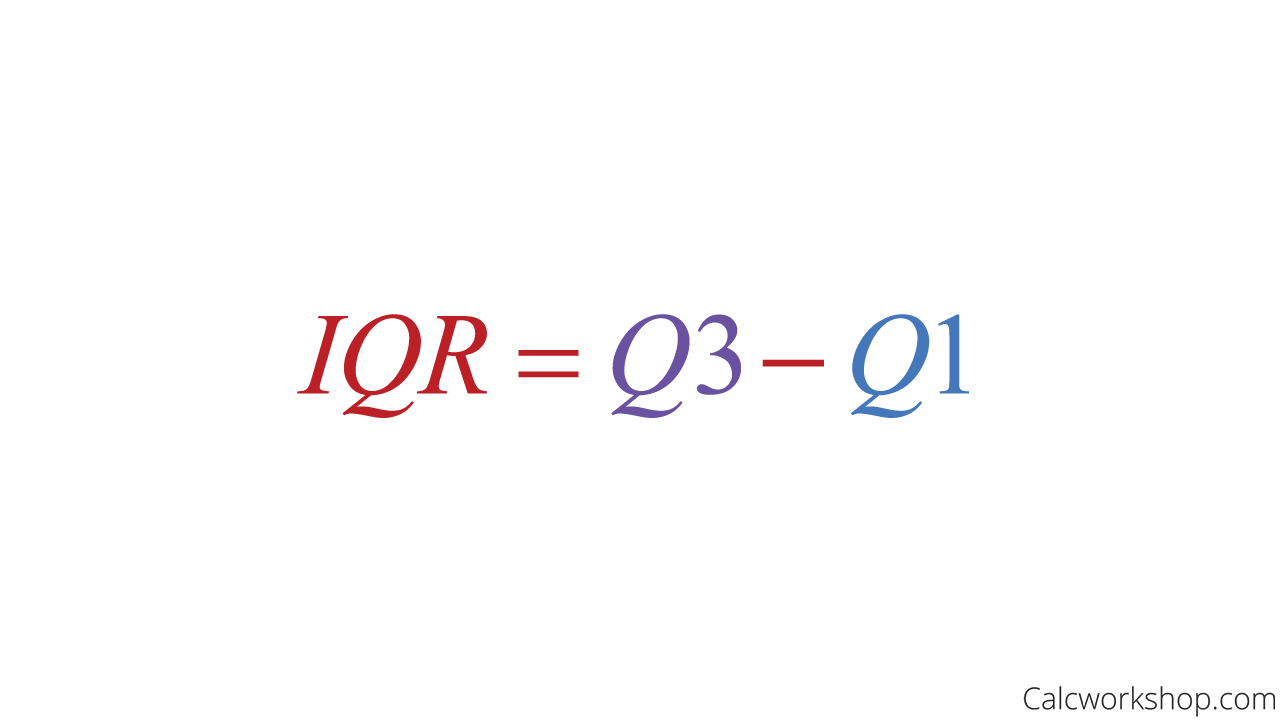
IQR Formula
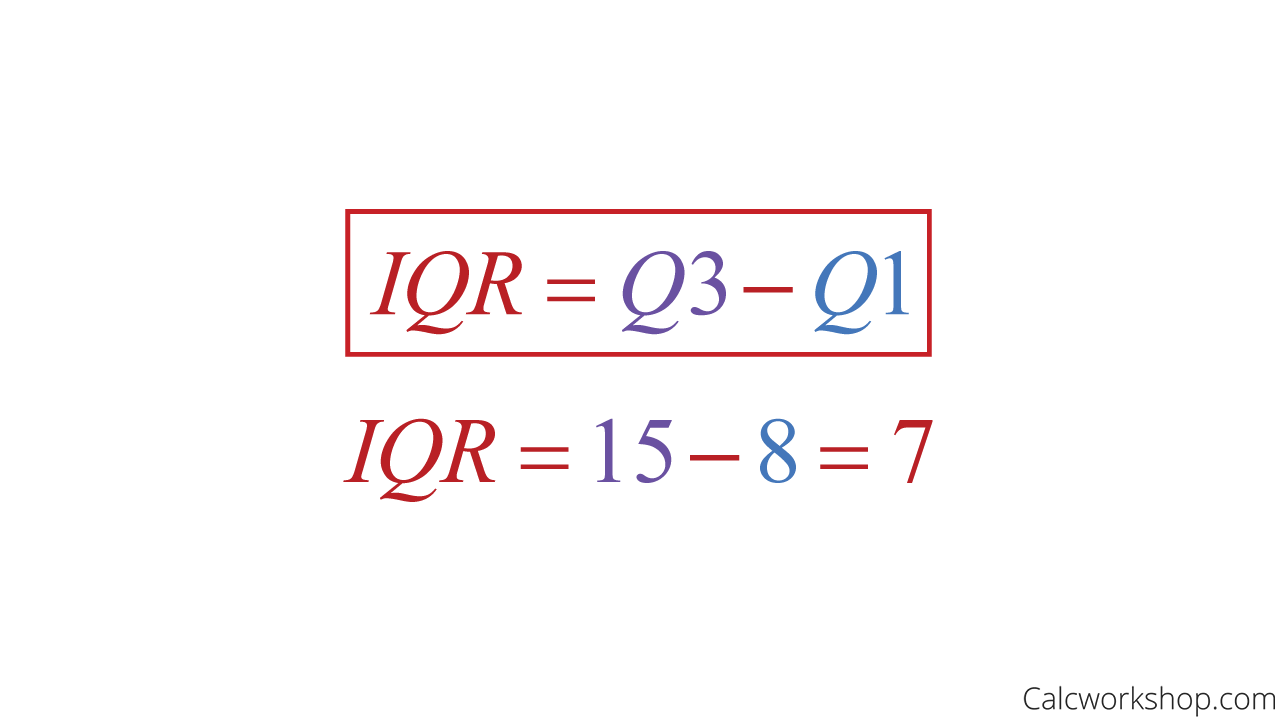
How To Calculate IQR
Outliers
But did you also know that the IQR is instrumental in identifying outliers?
Outliers are those values that don’t seem to fit the rest of the dataset. To locate outliers, we need to find our “fences,” or those numbers that enclose the data and indicate the acceptable range for our data set. If a number falls outside of the fence, then it is an outlier. We locate our fences by using our upper and lower quartiles and our interquartile range as follows:
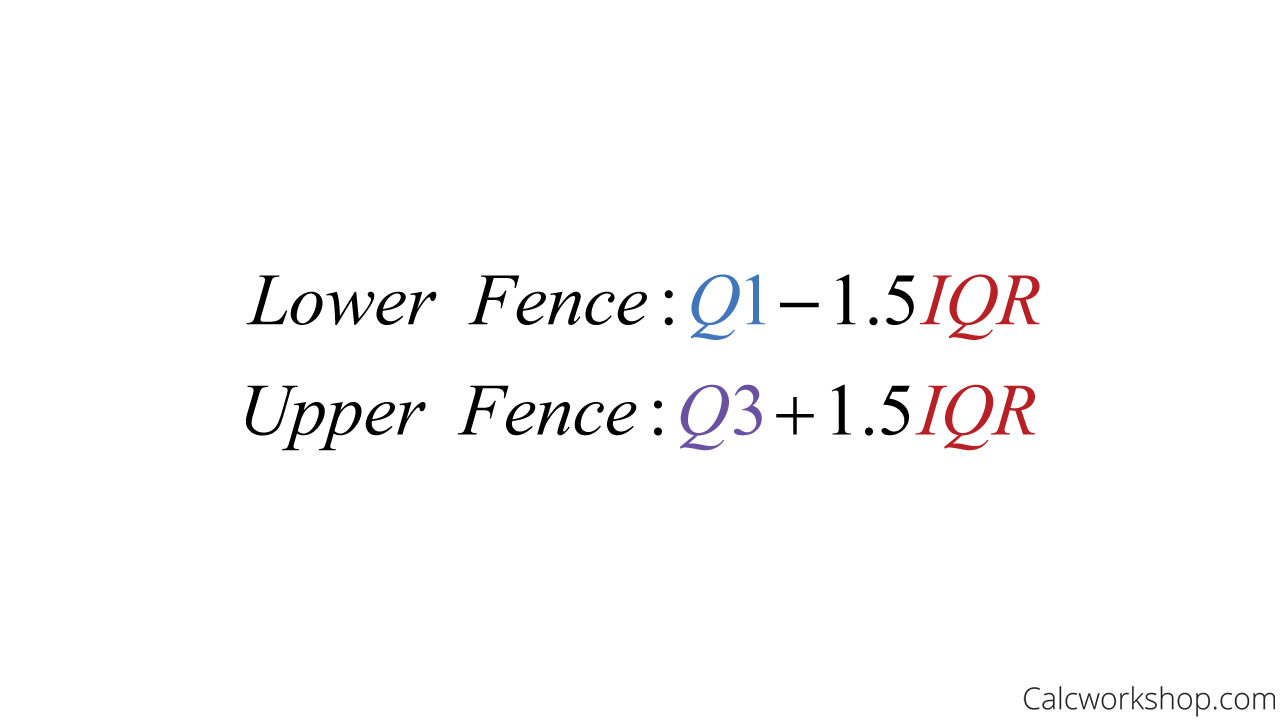
Outlier Formula
So, if we use our previous dataset of { 8, 12, 6, 13, 15, 18, 14, 20, 11, 7, 15 }, where we determined Q1 is 8, Q3 is 15, and the IQR is 7, then our lower and upper fences are:
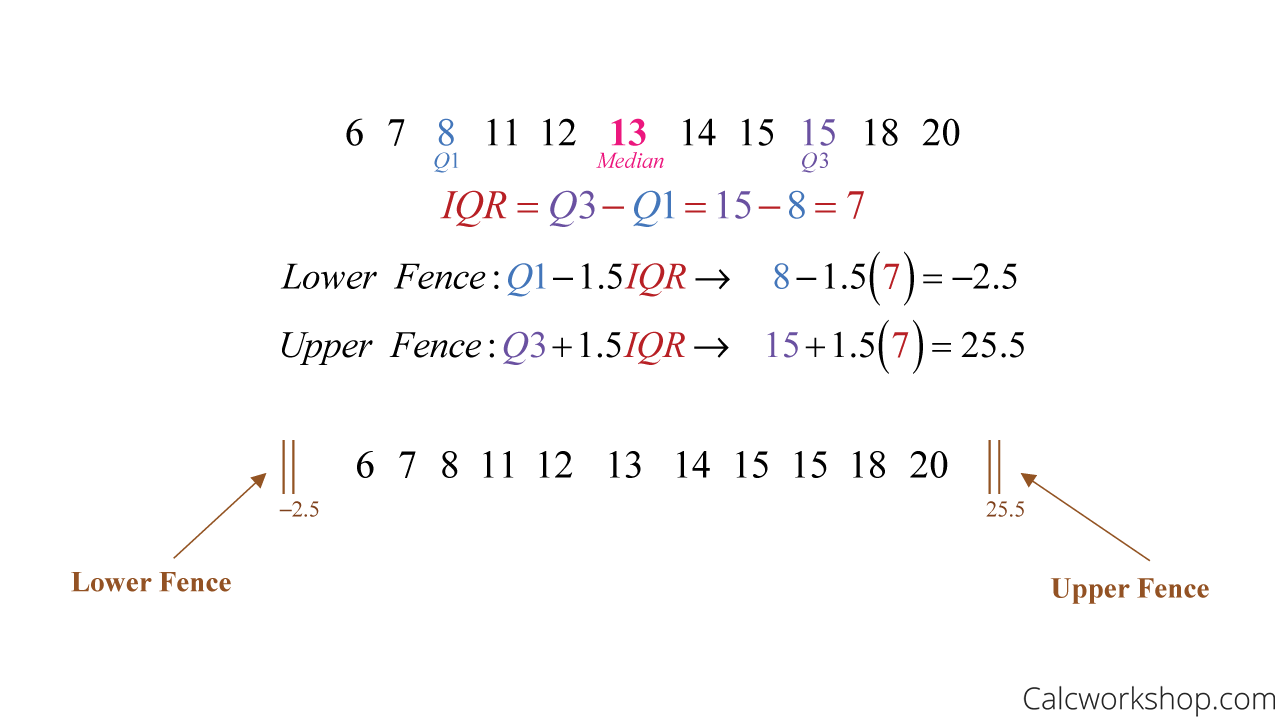
How To Calculate Outliers
As we can see, all of our data set falls within the fences, so we don’t have any outliers!
Measure Of Spread
But we can also describe the distribution in terms of its shape and spread.
The best way to analyze the deviations of each data value in relation to the mean is to find the variance and standard error.
While the quartiles and IQR only use a portion of the dataset, the variance and standard deviation use all the values in the set to measure spread.
Variance
So, the variance is a measure of how spread out a data set is.
Standard Deviation
The standard deviation also called the standard error is the square root of the variance and tells us how spread out the data is from the mean.
Meaning, if a dataset has a small standard error, then the data has a narrow spread around the mean and probably fewer extreme values. Conversely, if the standard error is high, the dataset is more spread out and may contain more extreme values.
Worked Example
For example, using our sample data { 8, 12, 6, 13, 15, 18, 14, 20, 11, 7, 15 }, let’s find the mean, variance, and standard error.
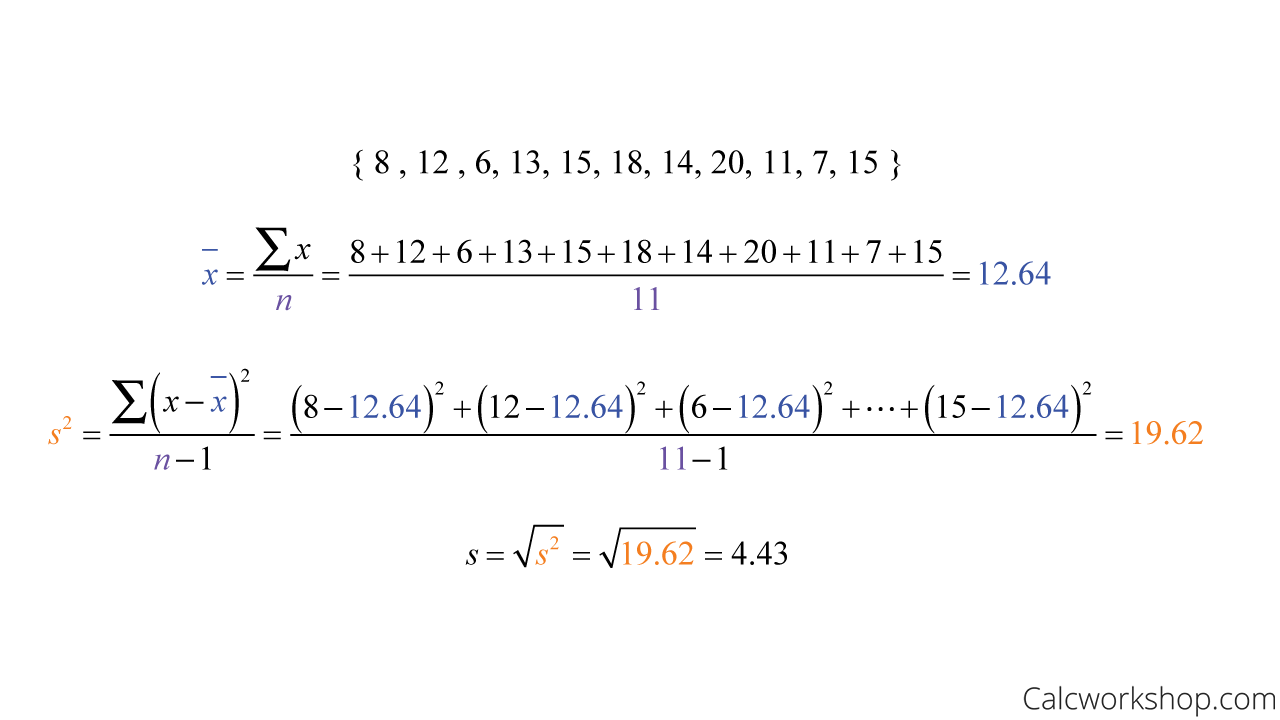
Sample Mean, Variance, and Standard Error Calculations
Displaying Quantitative Data
Now it’s time to talk about how best to display the measures of center?
There are five forms for displaying quantitative data:
- Dot Plot
- Stem Plot
- Cumulative Frequency Plot
- Histogram
- Box and Whisker Plot
Box And Whisker Plot
The first four we learned in our previous quantitative data video, now it’s time to talk about the Box Plot!
The Box and Whisker Plot also called a box plot, uses the following five-number summary:
- Minimum
- Quartile 1
- Median
- Quartile 3
- Maximum
The minimum is the smallest number in the dataset, and the maximum is the largest number in the dataset.
We construct a box and whisker plot by first identify our five-number summary. Then we create a box between the first and third quartiles, with the median in the middle. And then, we extend lines from the box to the minimum and maximum values (i.e., the whiskers) to show variability outside the upper and lower quartiles.
In this case, using our current sample data, the box plot is
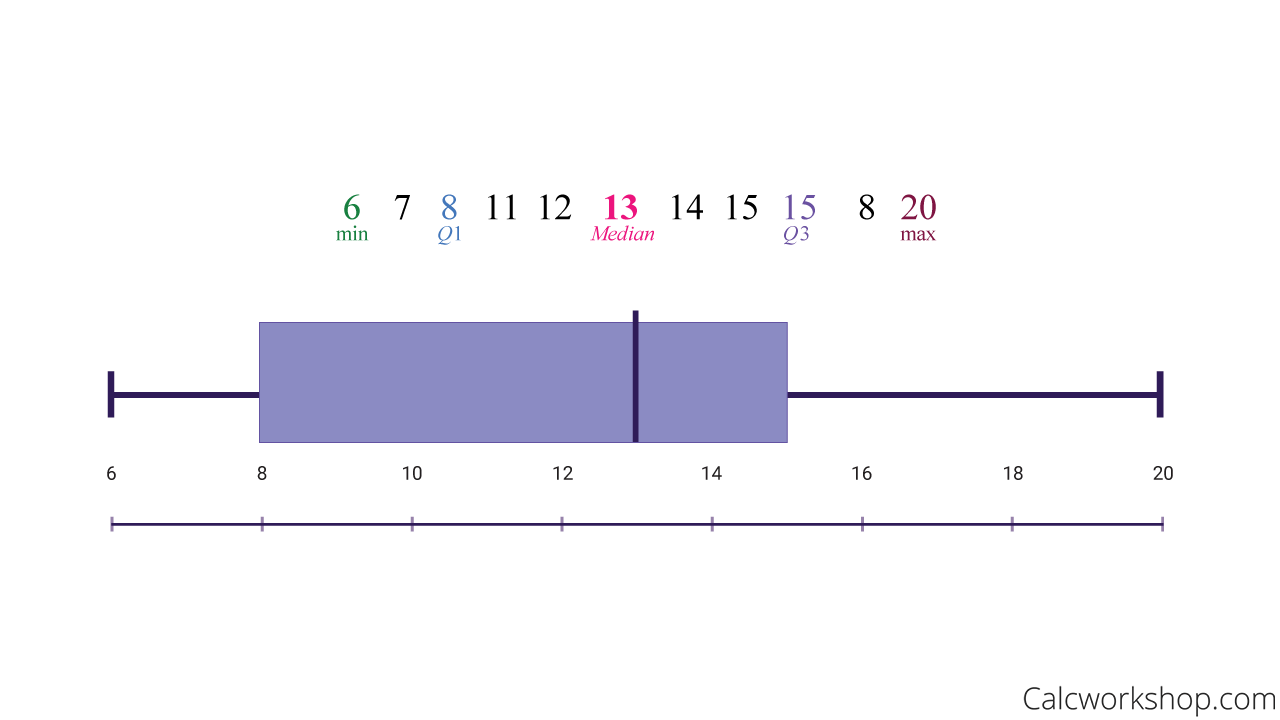
Box And Whisker Plot
Additionally, we will also look at how we can describe the distribution using a box plot and how we can modify a box-plot to identify outliers.
And lastly, we will wrap everything up with some words of wisdom on how best to choose the right measure of center and spread for a given distribution and how to draw conclusions based on the center, spread, and shape.
Let’s get to it!
Measures Of Center – Lesson & Examples (Video)
1 hr 10 min
- Introduction to Video: Measuring Center
- 00:00:25 – How do we find the Range, Mean, Median and Mode? with Example 1
- Exclusive Content for Members Only
- 00:09:35 – How do we find the IQR? (Examples #2-3)
- 00:17:23 – How do we use the IQR to determine Outliers? (Example #4)
- 00:26:06 – Creating Box Plots and finding 5-summary statistics (Example #5)
- 00:37:31 – Create a box and whisker plot and identify outliers (Example #6)
- 00:44:31 – Describe the distribution given a box-plot (Example #7)
- 00:48:30 – Finding Variance and Standard Deviation (Example #8)
- 00:59:10 – Find all the measures of center of spread and determine which measures of center should be used for a given distribution (Examples #9-10)
- Practice Problems with Step-by-Step Solutions
- Chapter Tests with Video Solutions
Get access to all the courses and over 450 HD videos with your subscription
Monthly and Yearly Plans Available
Still wondering if CalcWorkshop is right for you?
Take a Tour and find out how a membership can take the struggle out of learning math.