How do you find the summary statistics (standard deviation, expected value, and variance) for a discrete distribution?
Jenn, Founder Calcworkshop®, 15+ Years Experience (Licensed & Certified Teacher)
You’re in the right place because you’ll just that with these five step-by-step examples that follow.
Let’s go!
Two useful summaries for a probability distribution are the:
- Mean
- Variance
As they help us identify the middle and variability of a probability distribution.
The mean of a random variable is usually called the expected value, and the standard deviation is sometimes called the standard error.
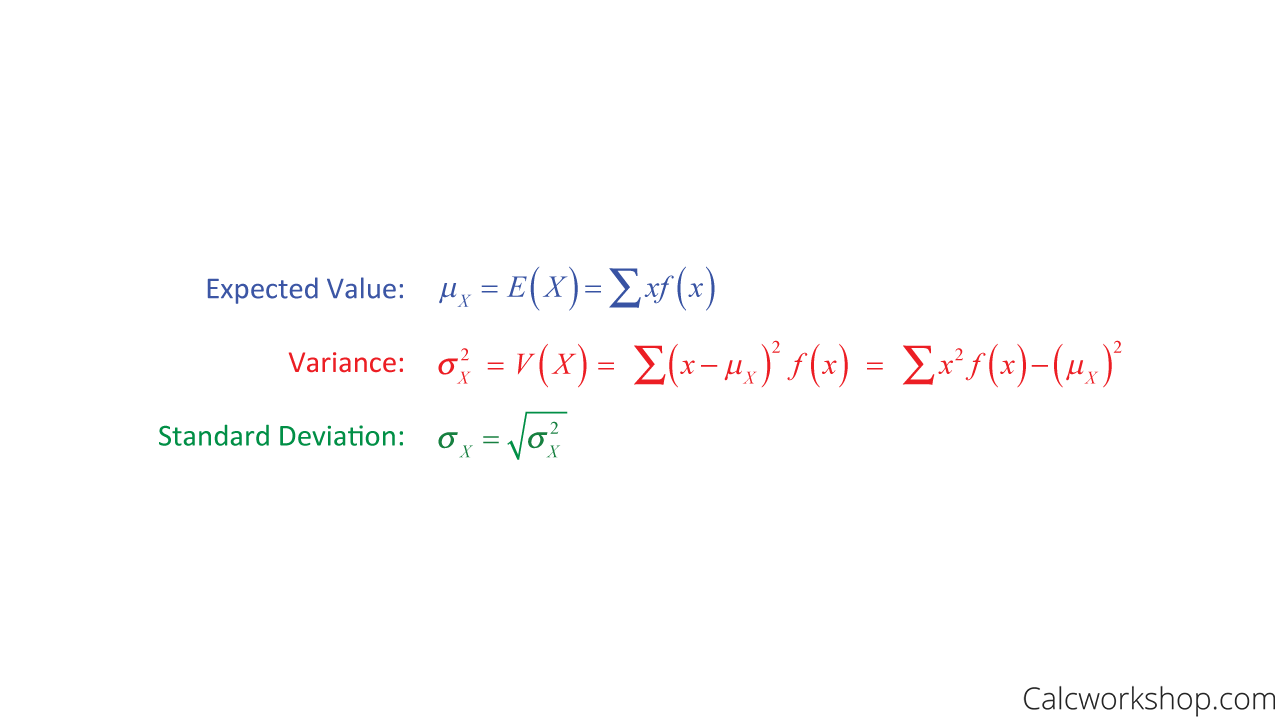
The formulas for finding the mean, variance, and standard deviation of a discrete random variable are:
Example
So, now that we are armed with our formulas for finding the measure of center and the measure of dispersion let’s see them in action.
For example, let’s determine the mean number of heads and the standard deviation in flipping a coin three times.
First, we need to create a sample space and probability distribution.
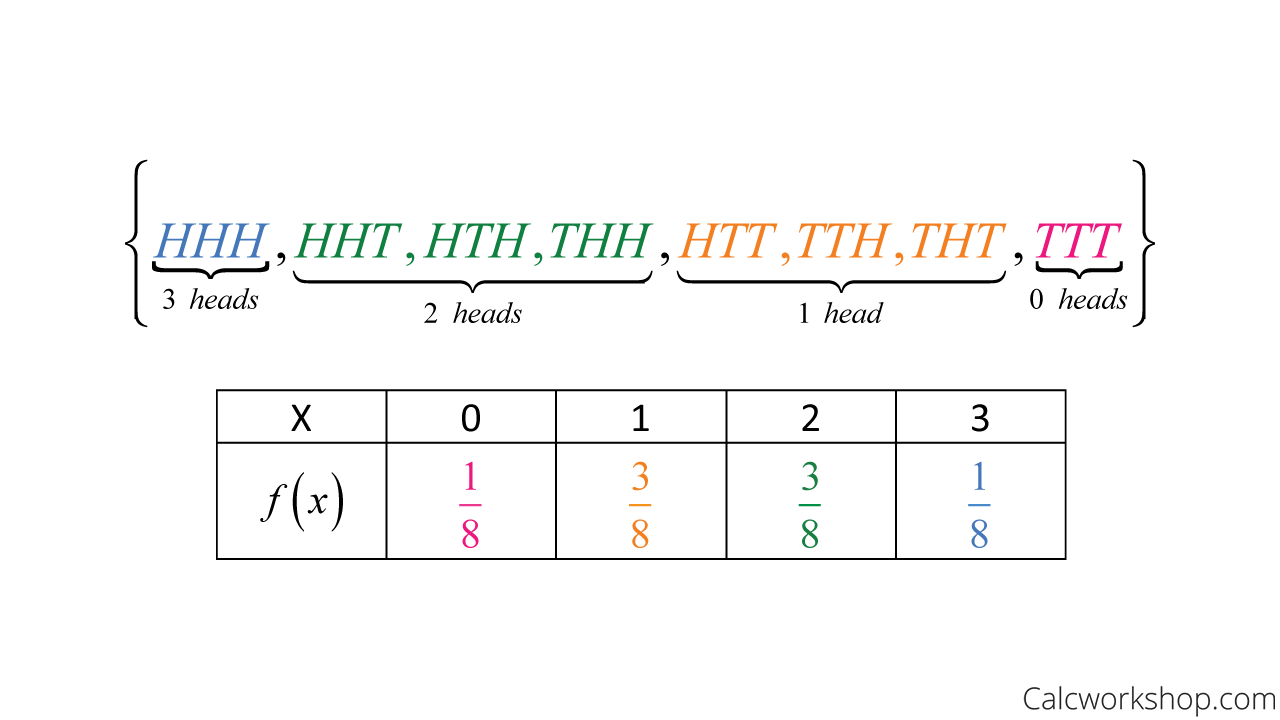
Sample Space For Recording Order Of Heads And Tails
What questions can you answer from the above sample space?
If you flip three fair coins, what is the probability that you’ll get at least two heads?
Well, by looking at our distribution we can see that getting at least two head is a 3/8 chance, whereas the probability that you’ll get all three heads is a 1/8 chance.
But is this what we expect? What’s the average number of heads when we flip a fair coins three times?
Let’s employ our formulas to find the:
- Expected Value (Mean)
- Variation
- Standard Error (Standard Deviation)
for our distribution.
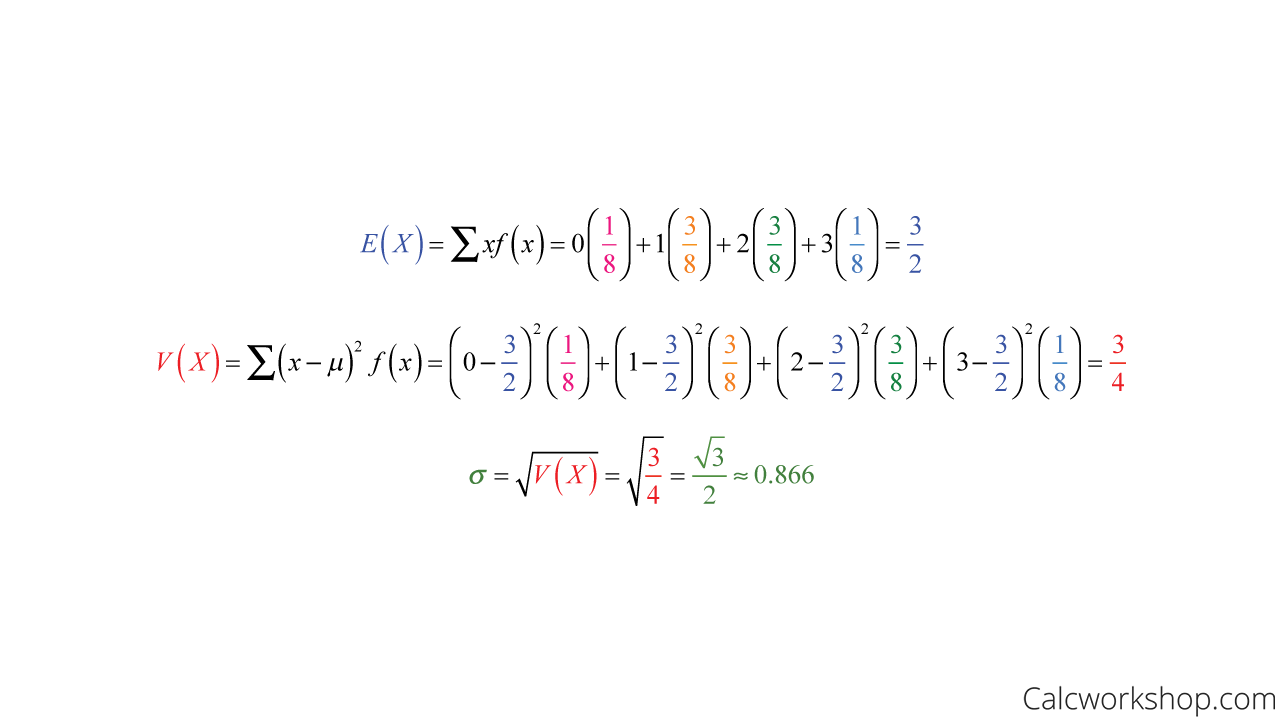
Consequently, if we flip a coin three times, we expect to get 1.5 heads, and the standard error or deviation is 0.866.
But, did you know that there’s an alternative form for finding the variance that is easy to use and extremely convenient?
The alternative formula for finding variance is as follows:
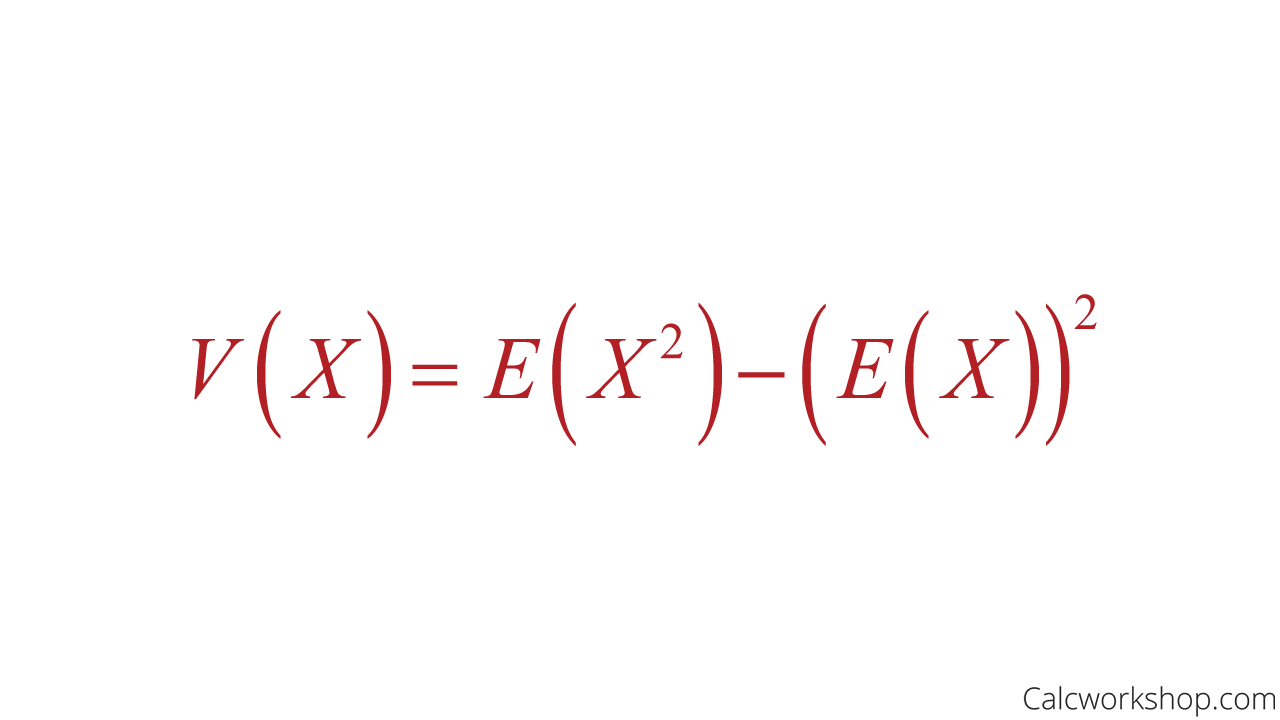
Alternate Formula For Variance
Example
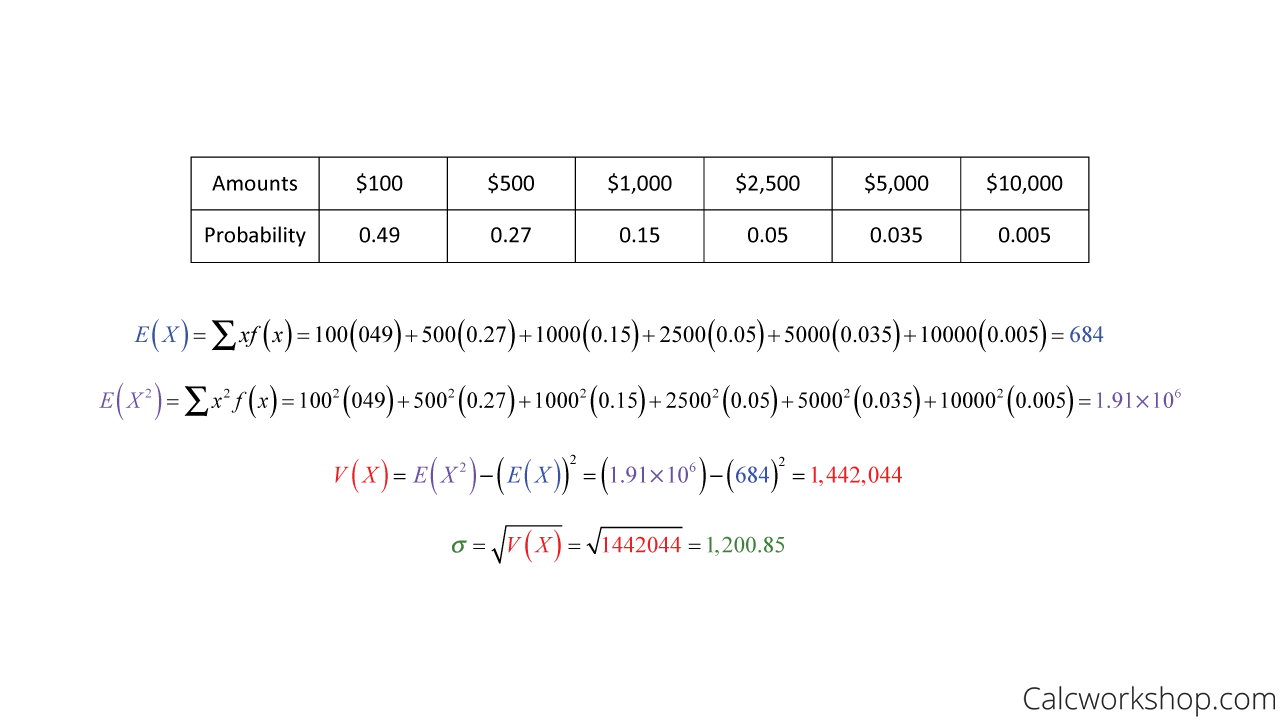
Let’s use this alternative formula for variance in the following question.
The Acme company offers flood insurance policies for homeowners. Below is a list of Acme payout claims due to flooding throughout a year. What is the expected amount that Acme will pay for flood claims in a year? And what is the standard error, or the spread of those payments?
Alternative Variance Example
Based on these numbers the Acme company should expect to pay $684 on average with a standard error of $1,200.85
Throughout this lesson, we will be using these formulas to successfully calculate the expected value, variance, and standard deviation for discrete distributions. We will also use these summary statistics to help us compare two discrete probability distributions.
Standard Deviation Variance Expected Value – Lesson & Examples (Video)
43 min
- Introduction to Video: Mean and Variance of a Discrete Random Variable
- 00:00:35 – How to find the expected value, variance and standard deviation of a discrete random variable with Example #1
- Exclusive Content for Members Only
- 00:11:32 – Given the probability distribution of X find the mean and variance (Example #2)
- 00:16:11 – Given the probability distribution and the mean, find the value of c in the range of X (Example #3)
- 00:20:31 – What is the expected profit and variability? (Example #4)
- 00:27:21 – How do rental vs owned housing units compare? Make a histogram comparing probability distributions (Example #5a)
- 00:33:44 – How do rental vs owned housing units compare? Find the mean number or expected number of rooms for both types of housing units (Example #5b)
- 00:37:50 – How do rental vs owned housing units compare? Find the standard deviation for both owner-occupied and renter-occupied distributions (Example #5c)
- Practice Problems with Step-by-Step Solutions
- Chapter Tests with Video Solutions
Get access to all the courses and over 450 HD videos with your subscription
Monthly and Yearly Plans Available
Still wondering if CalcWorkshop is right for you?
Take a Tour and find out how a membership can take the struggle out of learning math.