In today’s statistics lesson, you’re going to learn all about the Weibull Distribution and the Lognormal Distribution.

Jenn, Founder Calcworkshop®, 15+ Years Experience (Licensed & Certified Teacher)
Both of these distributions are essential to reliability analysis in engineering. They’re also going to be necessary for your grade in either AP or College Stat, so…
…let’s get to it!
Weibull Distribution
The Weibull distribution is used to model life data analysis, which is the time until device failure of many different physical systems, such as a bearing or motor’s mechanical wear. In other words, it can assess product reliability and model failure times!
The distribution parameters help us measure whether or not the number of failures is increasing with time, decreasing with time, or remaining constant.
Formulas
A random variable X is said to have a Weibull distribution if:
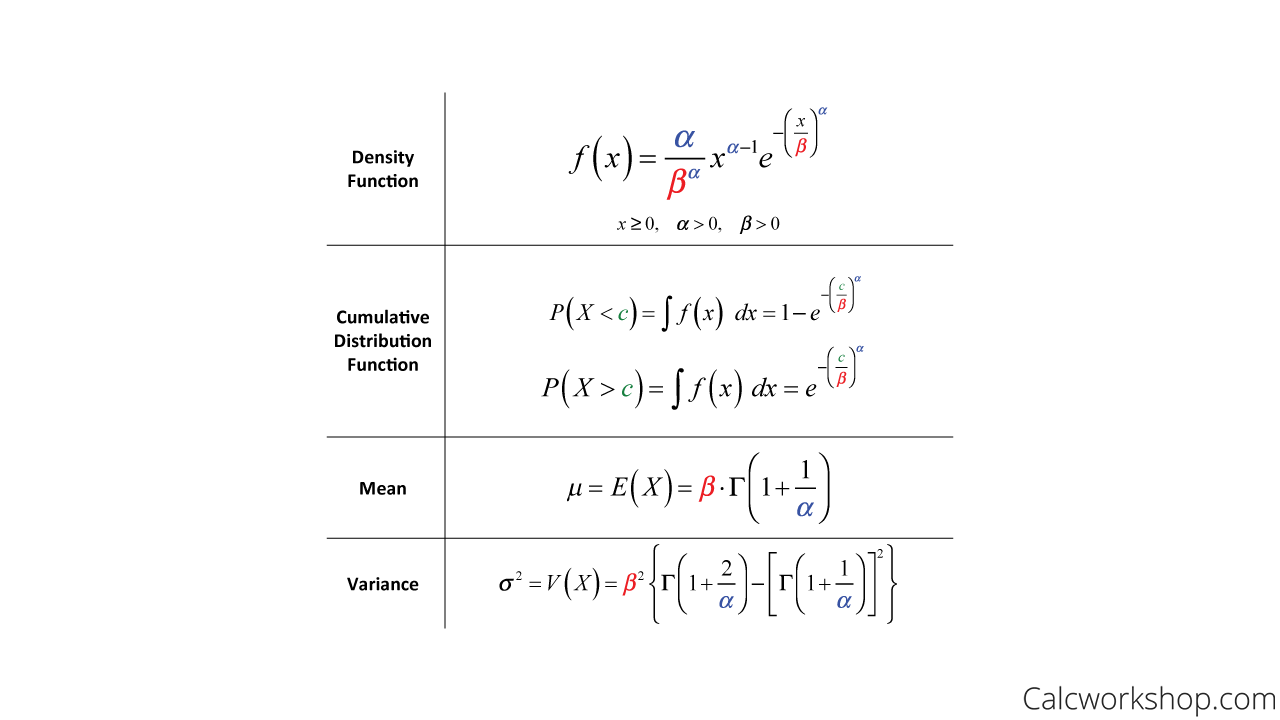
Weibull Distribution Formulas
As you can see from the formulas above, we will also be drawing upon our knowledge of the Gamma Function and Distribution to help us find our expected values and variance. And just like we saw with the exponential distribution, different textbooks will use other variables for parameters, and some show formulas with 3, 2, or 1 parameter depending on how they define the shape and scale of the distribution. Regardless of the number of parameters or the chosen variables, the vital thing to know is what affects the shape and scale.
Alpha & Beta
So, let’s look at those crucial characteristics of the parameters alpha and beta.
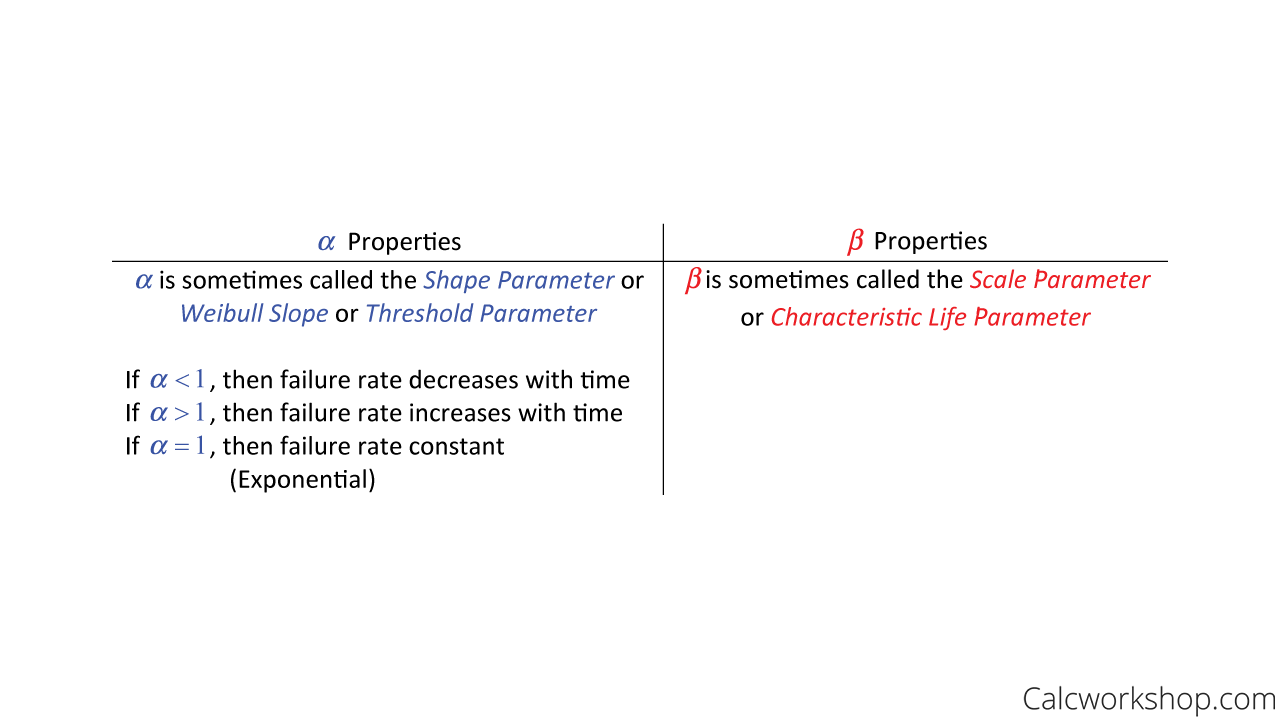
Weibull Distribution Parameters (Shape and Scale)
Notice that if the shape parameter (alpha) is equal to 1, then the Weibull distribution becomes the Exponential distribution! And, as the scale parameter (beta) increases, the Weibull distribution becomes more symmetric.
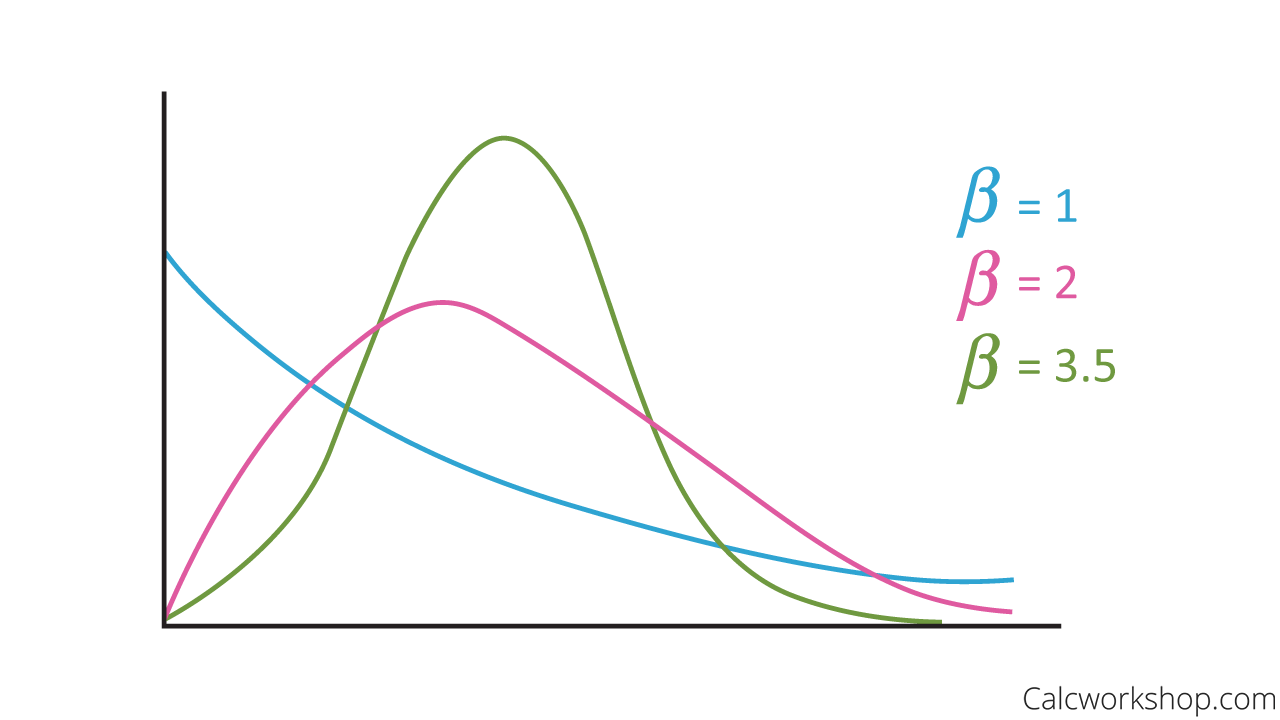
Weibull Density Curve
Example
Okay, so let’s look at an example to help make sense of everything!
Suppose the time to failure, in hours, of a bearing in a mechanical shaft, is a Weibull random variable with the following parameters. Determine the mean time until failure.
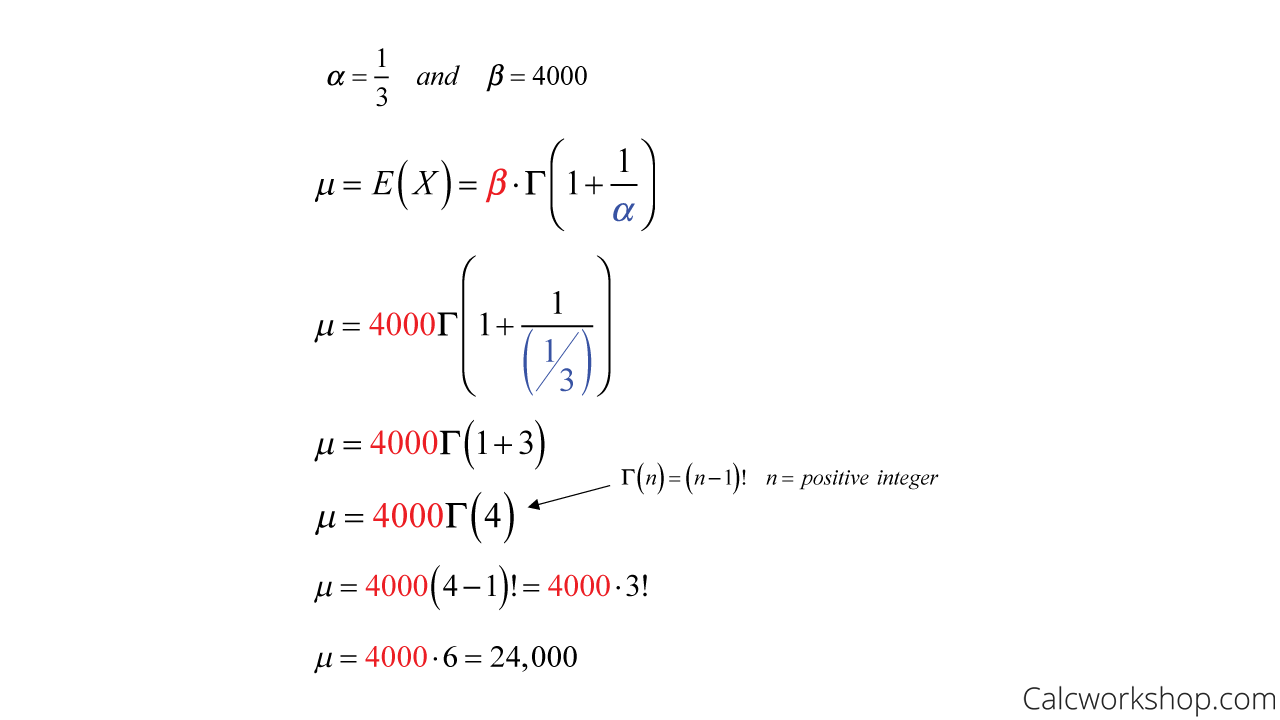
Mean of Weibull Distribution — Example
Then we should expect 24,000 hours until failure.
Now, using the same example, let’s determine the probability that a bearing lasts a least 5000 hours.
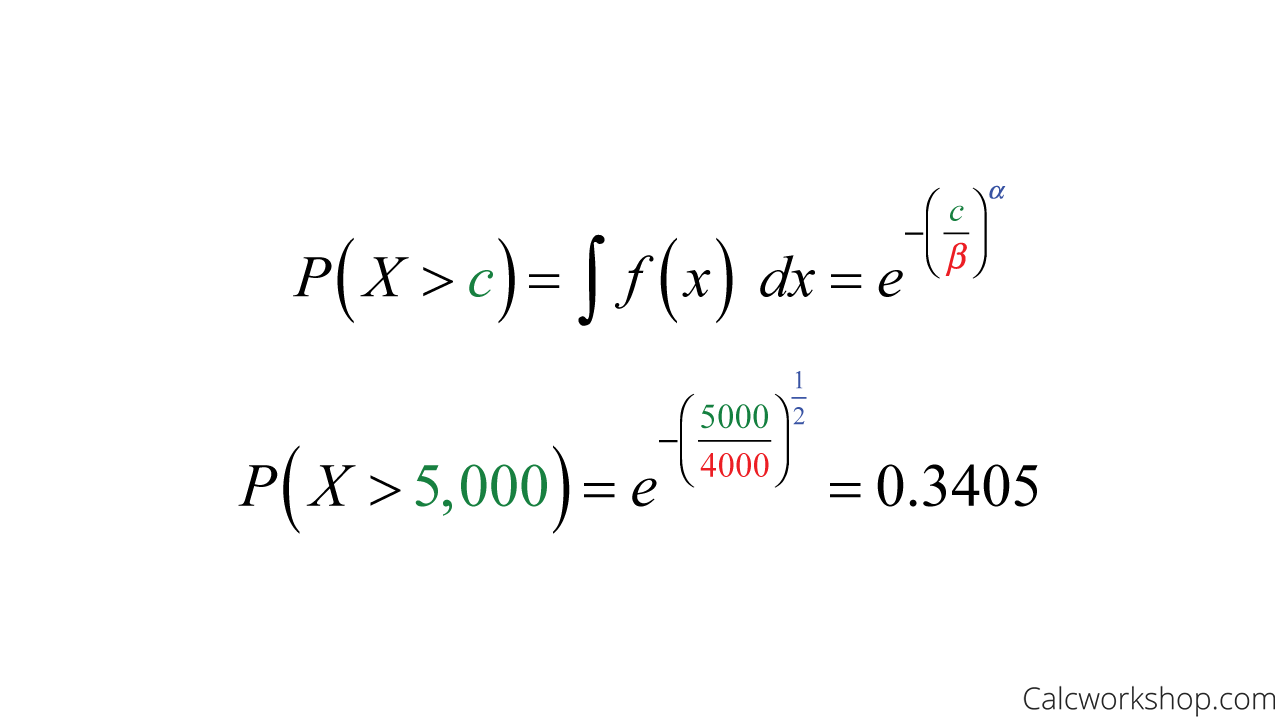
CDF of Weibull Distribution — Example
This means that only 34.05% of all bearings will last at least 5000 hours.
Lognormal Distribution
But there is another critical distribution that also models failure rates: Lognormal Distribution!
The lognormal distribution is most commonly used to assess fatigue-stress on mechanical systems. Therefore, the Weibull and Lognormal distributions are great complements or partners.
Lognormal Vs Weibull
So when should we use the Weibull, and when should we use the Lognormal as both model the same thing?
Well, the Weibull is exceptionally flexible and can be used universally for determining failure rates. Still, the Lognormal really shines for skewed distributions with lower value means values, large variances (i.e, data with a large standard deviation), and all-positive values. Additionally, if we were to take the natural log of each random variable and its result is a normal distribution, then the Lognormal is the best fit.
In other words, a random variable Y is said to follow a lognormal distribution if the log of Y follows a normal distribution.
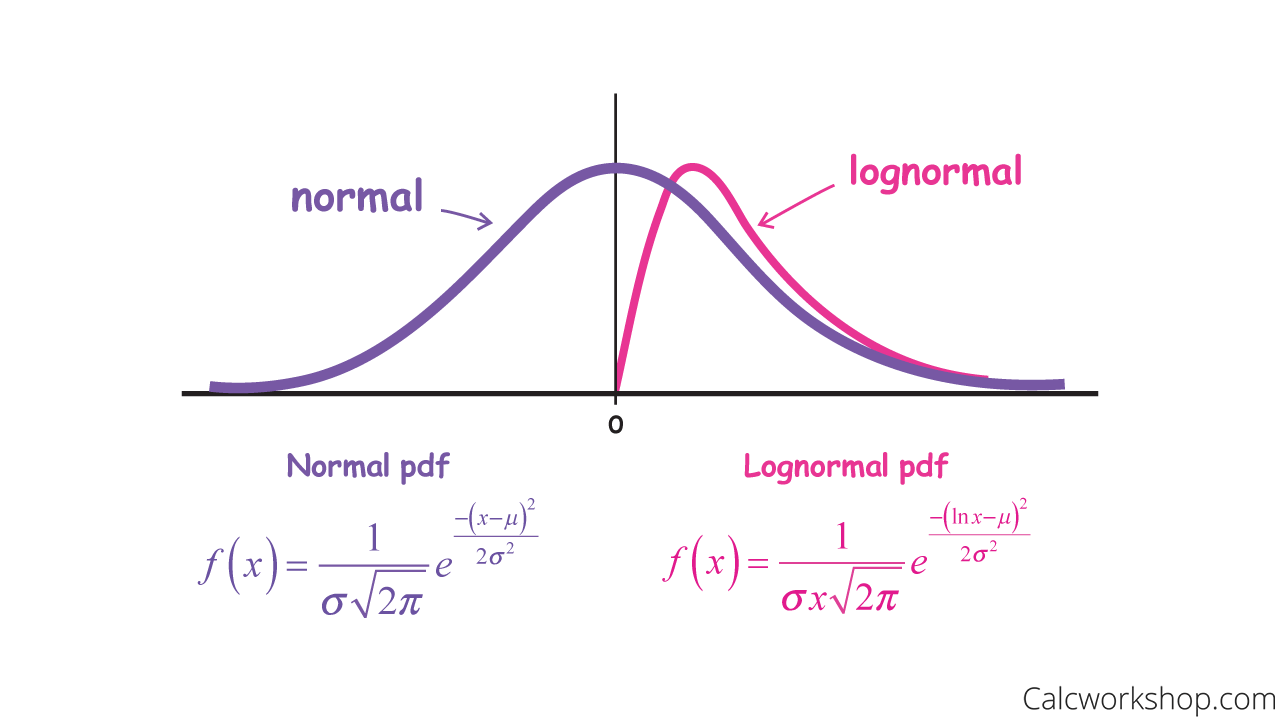
Lognormal Vs Normal Density Curves
And just like the normal distribution, finding the cumulative probability density function can not be done algebraically. Thankfully we can rely on the z-table after transforming to find our probability values!
Formulas
Let’s look at the Lognormal properties:

Lognormal Distribution Formulas
While the capital phi symbol looks intimidating at first, all it’s doing is telling you to take the natural log of the random variable x, and then find the standard score (i.e., z-score) of this value!
So, whenever you see the capital phi greek letter, I want you to think z-score of the natural log of x!
Example
Okay, so let’s look at an example.
Suppose the lifetime of a motor has a lognormal distribution. What is the probability the lifetime exceeds 12,000 hours if the mean and standard deviation of the normal random variable are 11 hours and 1.3 hours, respectively?
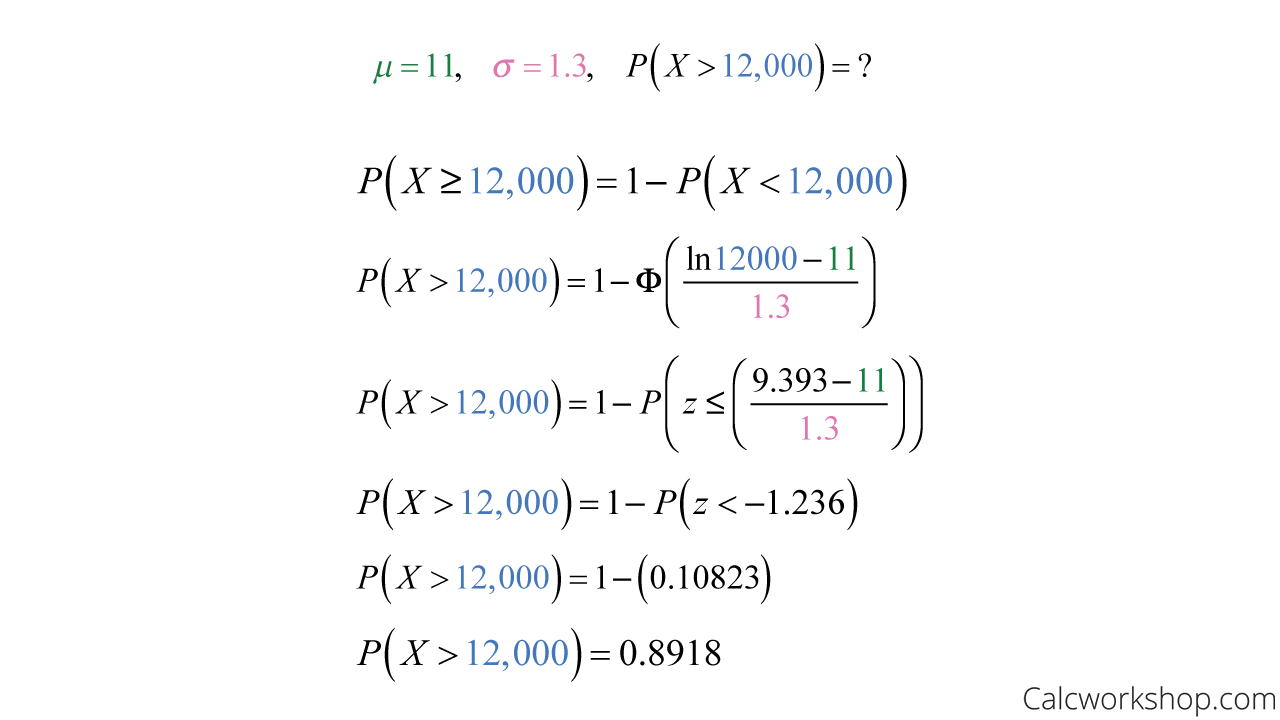
CDF of Lognormal Distribution — Example
This means that there is about an 89.18% chance that a motor’s lifetime will exceed 12,000 hours.
Throughout this video lesson, we work countless examples to help us explore the Weibull and Lognormal distributions and see their strengths in helping us determine the failure rate for mechanical systems.
Weibull Lognormal Distribution – Lesson & Examples (Video)
56 min
- Introduction to Video: Weibull and Lognormal Distributions
- 00:00:41 – Overview of the Weibull Distribution and formulas with Example #1
- Exclusive Content for Members Only
- 00:15:38 – Assume a Weibull distribution, find the probability and mean (Examples #2-3)
- 00:25:20 – Overview of the Lognormal Distribution and formulas
- 00:31:43 – Suppose a Lognormal distribution, find the probability (Examples #4-5)
- 00:45:24 – For a lognormal distribution find the mean, variance, and conditional probability (Examples #6-7)
- Practice Problems with Step-by-Step Solutions
- Chapter Tests with Video Solutions
Get access to all the courses and over 450 HD videos with your subscription
Monthly and Yearly Plans Available
Still wondering if CalcWorkshop is right for you?
Take a Tour and find out how a membership can take the struggle out of learning math.