We know how to find confidence intervals for one-sample population means, but how do you find the difference between two means for two-sample confidence intervals?

Jenn, Founder Calcworkshop®, 15+ Years Experience (Licensed & Certified Teacher)
Great question.
That’s why in today’s lesson you’re going to learn how to construct a confidence interval to estimate the difference in population means using two samples and test statistics!
Let’s go!
Well, there are three different types of confidence intervals for the difference of population means:
- Independent samples where the population standard deviations are known.
- Independent samples where the population standard deviations are unknown.
- Dependent (matched pair) samples.
Independent Samples
Depending on the sample types and whether or not the population standard deviation is known will depend on whether we employ either a z-test or t-test.
In that case, we will use a z-test and follow the following formula for constructing a confidence interval for the difference of means.
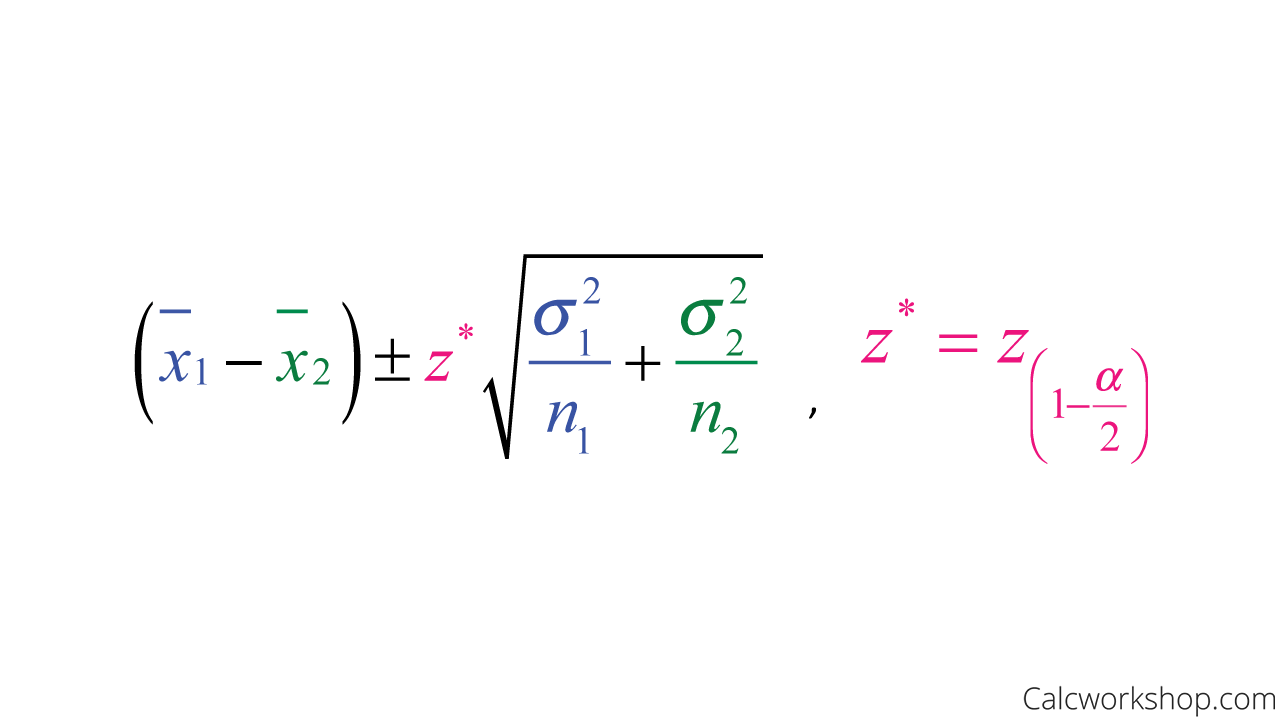
Confidence Interval Formula For Two Sample Mean
But for two independent random samples where the standard deviation is unknown, and the sample size is sufficiently large, then we will have to use a t-test, which involves a t-distribution with degrees of freedom, as well as the possibility of pooled variances.
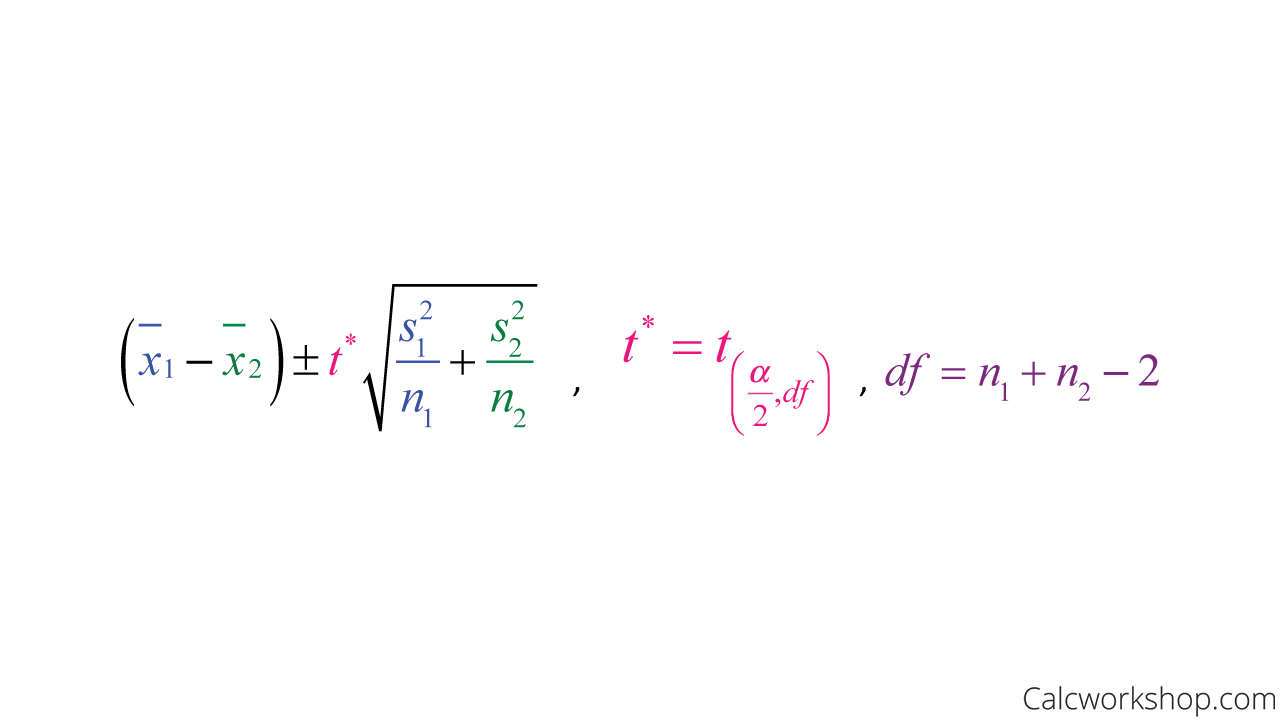
Formula For Two Sample Mean With Unknown Standard Deviation
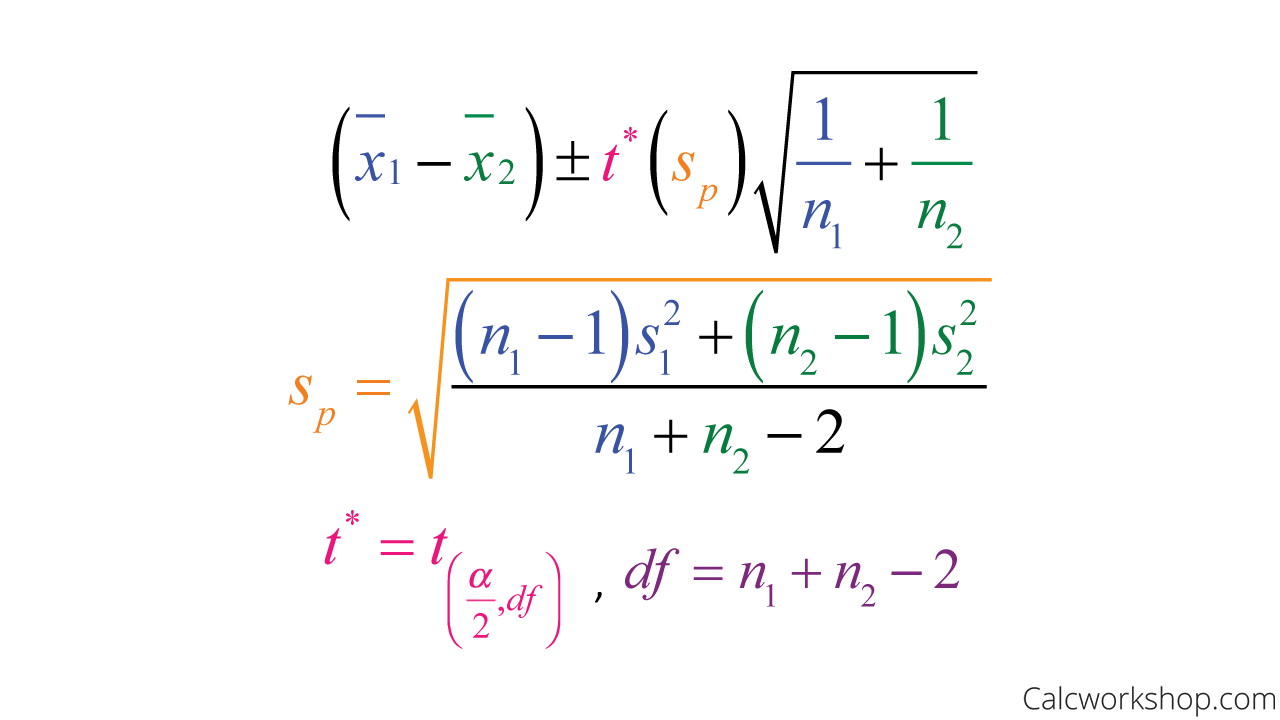
Pooled Variance Formula For Two Sample Mean
Pooled Variance
We find an F-statistic and compare it with the critical value.
If the F-statistic is less than or equal to the critical number, we will pool our variances. Otherwise, we will not pool.

F Statistic Formula
Worked Example
For example, suppose a random sample of high school students is selected to determine if there is a difference between how long male and female students sleep at night.
If 83 male students are randomly chosen and yield an average of 6.6 hours of sleep with a standard error of 1.8.
And 65 females are randomly selected with an average of 6.9 hours of sleep with a standard error of 1.5.
Construct a 95% confidence interval for the difference between the two mean sleep hours for males vs. females.
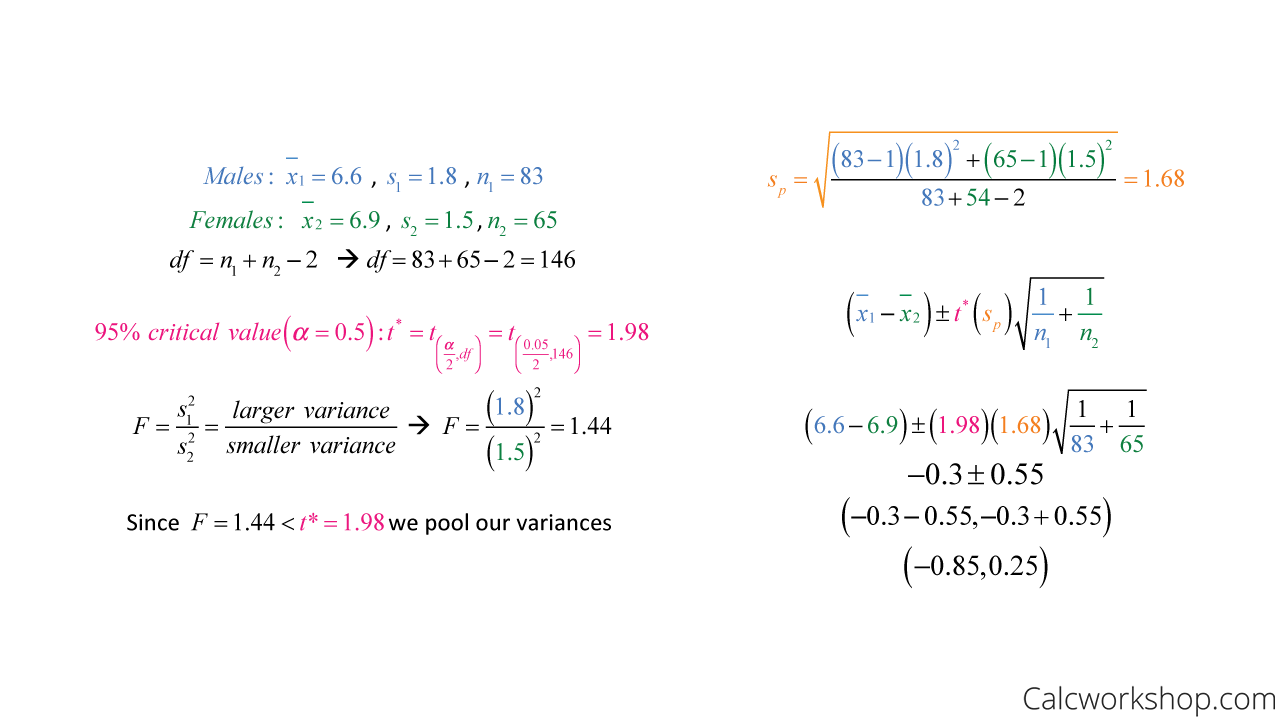
Pooled Variance Example
Unfortunately, because the confidence interval contains zero, we cannot determine if there is a difference in population means, as they could be equal. This is because zero is the value specified in the null hypothesis (i.e., the null value of the parameter), which demonstrates that there is no statistically significant difference between groups.
Please note, that it is very rare to have two independent samples with equal, or almost equal, variances; therefore, the formula for un-pooled variances is more readily used but not always, so it is essential to check.
Dependent Samples
And our last type of confidence interval for the difference of population means is for dependent sample means.
Meaning, the difference between means is due to different conditions of the population and not due to the experimental units in the study. This is called a matched pair interval.
The great thing about a paired sample is that it becomes a one-sample confidence interval.
First, we find the difference between the two samples. In other words, we subtracting the “before” and “after” values to find the “difference.”
Next, we calculate the sample mean and sample standard deviation using the values from the difference column.
Worked Example
For example, a big push in education is to have students take a pretest before learning a new topic and then compare them with a post-test after the unit.
So, let’s suppose data is collected from nine students where their scores on a pretest are compared with the scores on the post-test, and we want to compare the average difference between the two tests, as shown below.
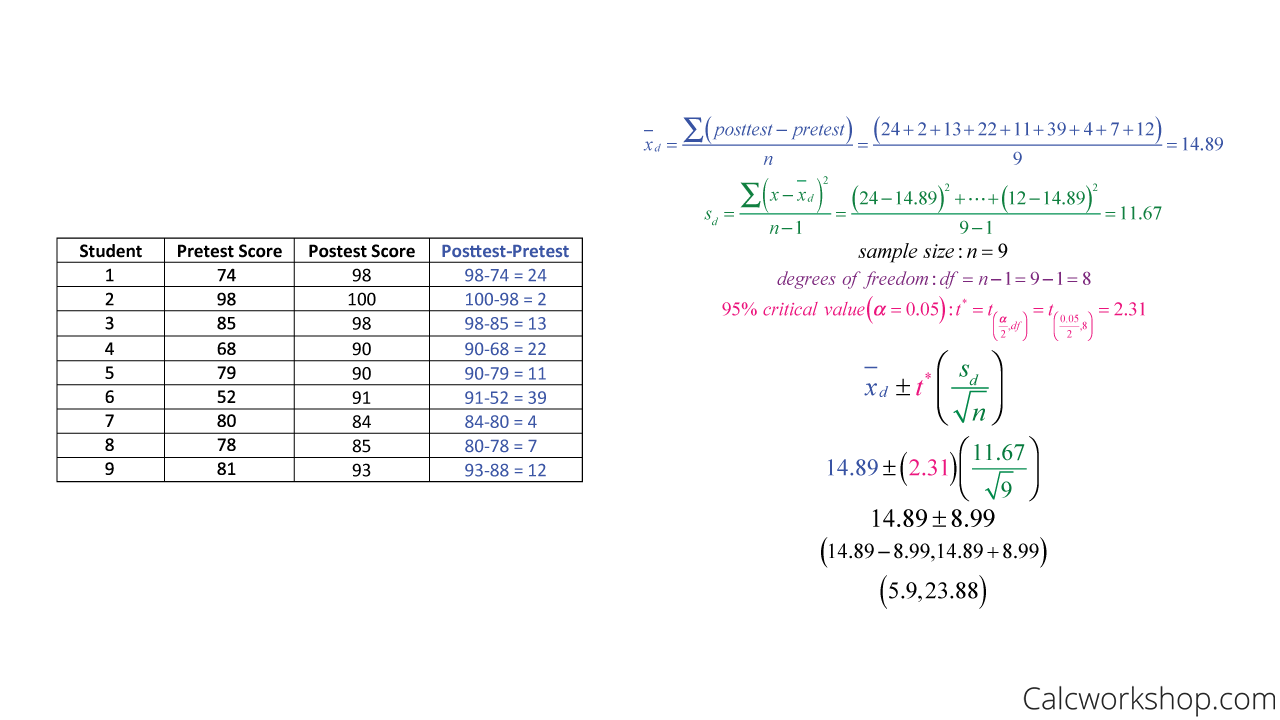
Matched Pairs Example
We are 95% confident that the average difference between the pretest and the post-test is between 5.9 points and 23.88 points.
By working through countless examples of how to create confidence intervals for the difference of population means, we will learn to recognize when to use a z-test or t-test and when to pool or not based on the sample data provided.
Difference in Means – Lesson & Examples (Video)
1 hr 11 min
- Introduction to Video: Two-Sample Confidence Intervals for Means
- 00:00:39 – Finding the difference of means when population standard deviation is known (Example #1)
- Exclusive Content for Members Only
- 00:10:38 – Understanding Matched Pair Samples for difference of means (Example #2)
- 00:22:13 – For the matched pair dataset find confidence interval for difference of means (Example #3)
- 00:30:51 – Conduct a confidence interval for difference of means for non-pooled variances (Example #4)
- 00:36:58 – Conduct a confidence interval for difference of means for pooled variances (Example #5)
- 00:47:07 – Create a confidence interval for two independent samples for difference of means (Examples #6-7)
- 00:54:44 – Flowchart organizing one-sample and two-sample confidence intervals for both proportions and means
- 01:08:28 – replace
- Practice Problems with Step-by-Step Solutions
- Chapter Tests with Video Solutions
Get access to all the courses and over 450 HD videos with your subscription
Monthly and Yearly Plans Available
Still wondering if CalcWorkshop is right for you?
Take a Tour and find out how a membership can take the struggle out of learning math.