Ever gazed at a world map and wondered why the countries or regions are shaded in different colors?

Jenn, Founder Calcworkshop®, 15+ Years Experience (Licensed & Certified Teacher)
Well, it’s not just for aesthetics.
These colors help us quickly identify borders and distinguish one place from another.
But hold on, how many colors do we really need for that?
Enter the fascinating world of graph coloring!
Transforming Maps into Graphs: Vertex Magic
In simple terms, graph coloring means assigning colors to the vertices of a graph so that none of the adjacent vertices share the same hue. And, of course, we want to do this using as few colors as possible.
Imagine Australia, with its eight distinct regions (a.k.a. states).
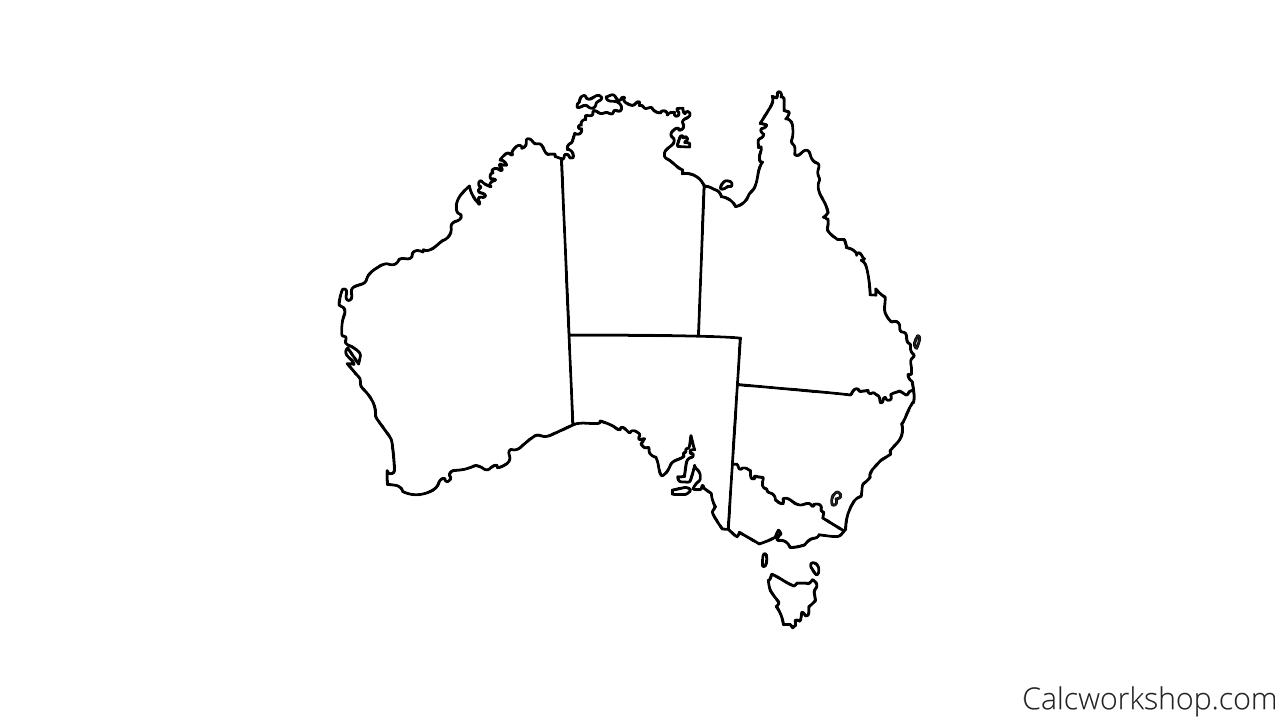
Map Australia Regions
Let’s turn this map into a graph, where each region is a vertex, and shared borders connect these vertices with edges as defined by graph theory.
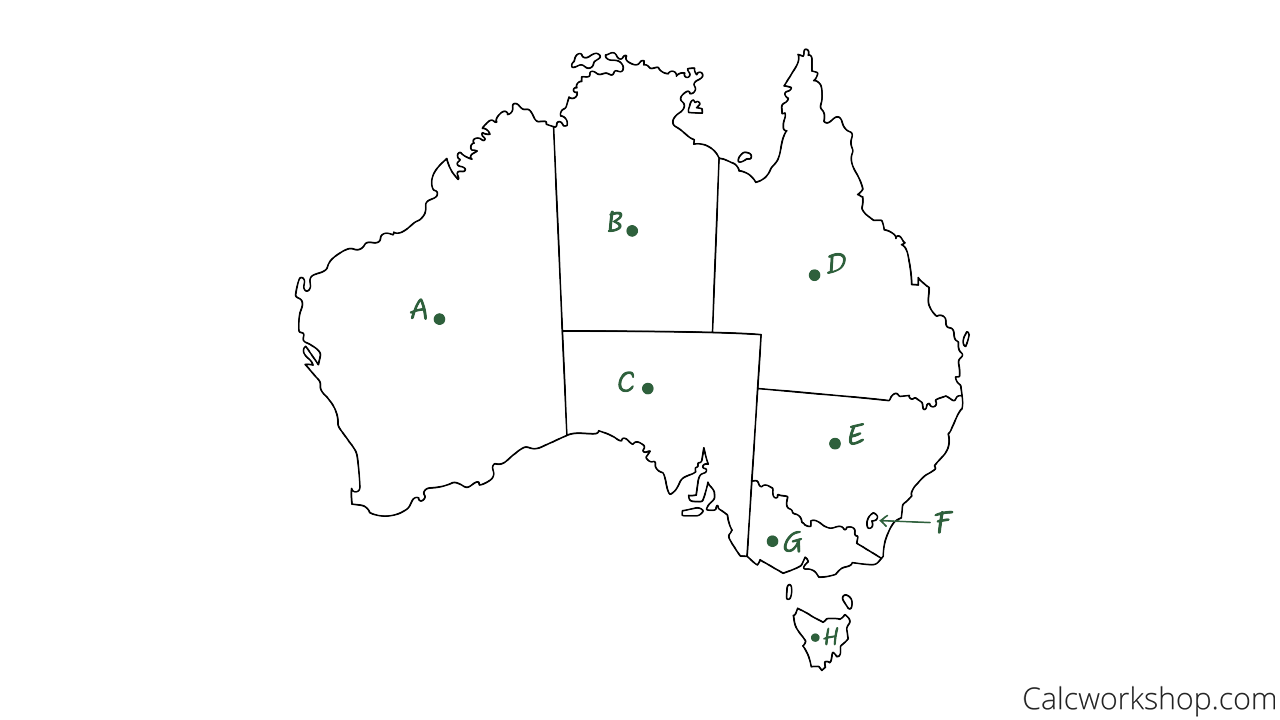
Transform Australia Region Map
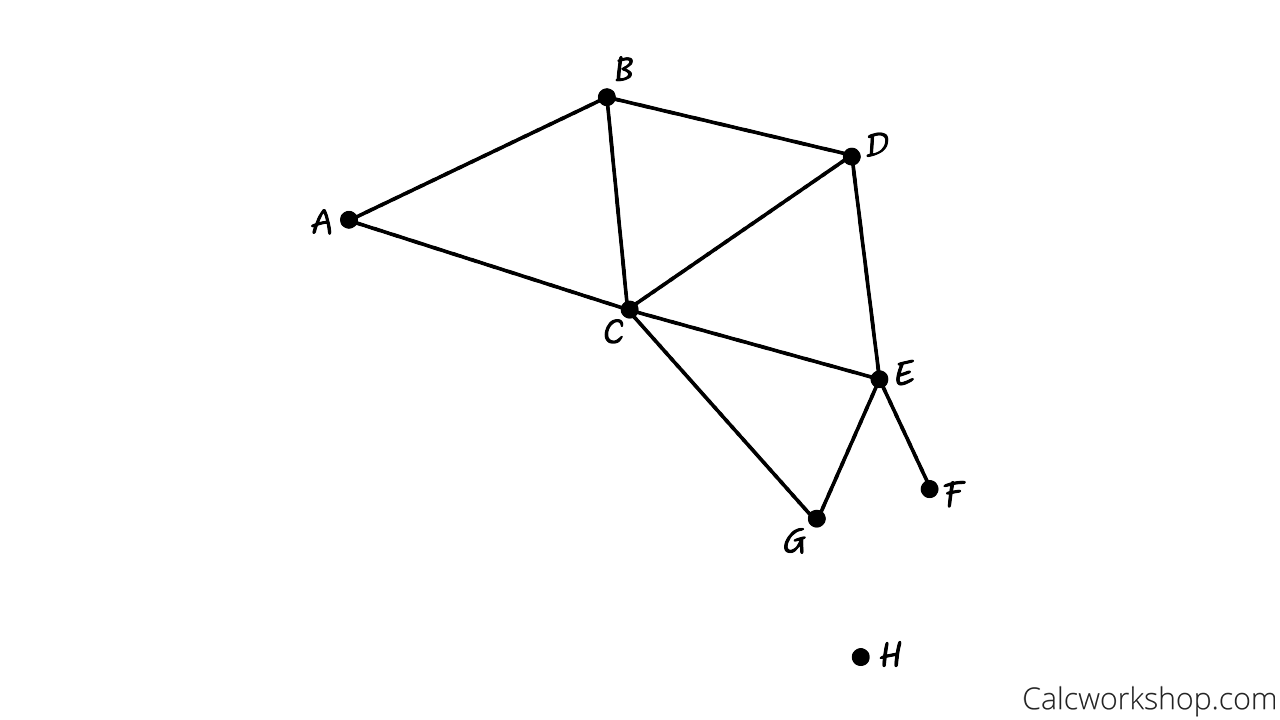
Dual Graph Australia
Sounds intriguing, yes?
Graph Coloring Australia: A Three-Color Example
Now, let’s get coloring!
We’ll start with vertex A, painting it a lovely shade of blue. Since vertices B and C are directly connected to A (and each other), we must give them different colors.
How about red and green? Christmas vibes, anyone?
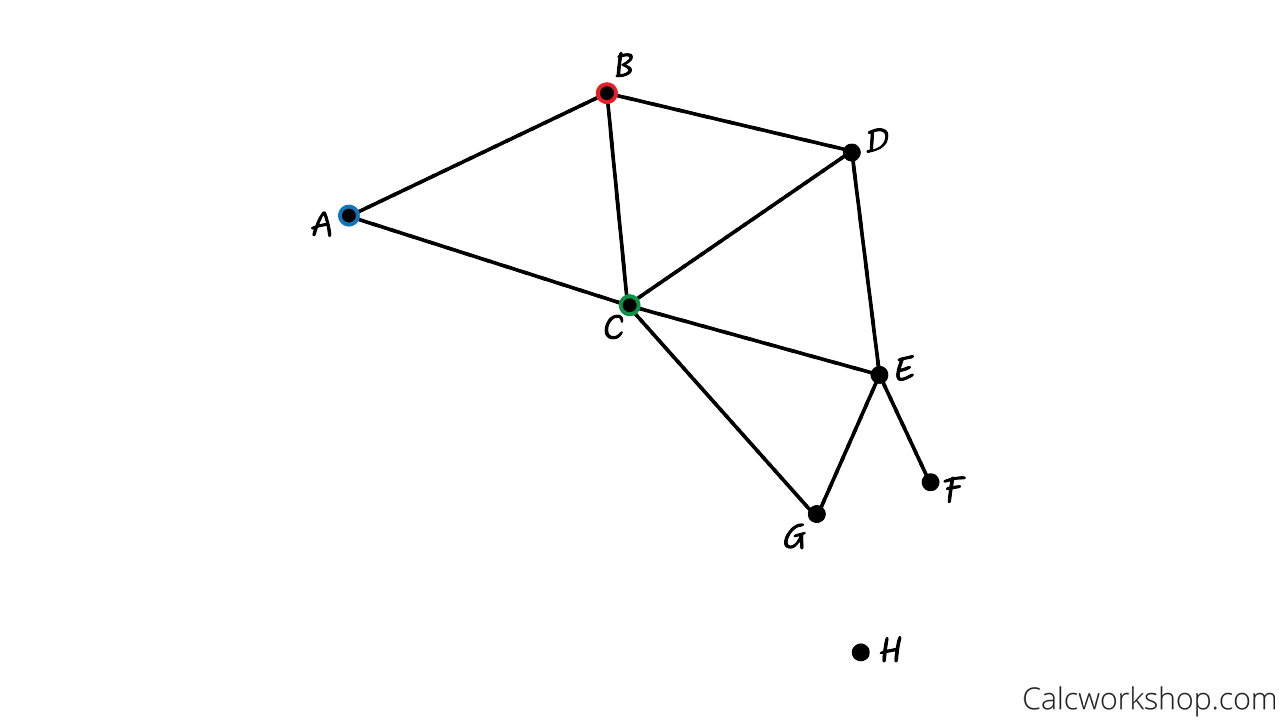
Assign Colors Dual Graph Example 1
Moving on to vertices D, E, and G.
Since D and G don’t share a border with A, we can color them both blue (yay, for reusing colors!). And vertex E gets red because it doesn’t connect with vertex B.
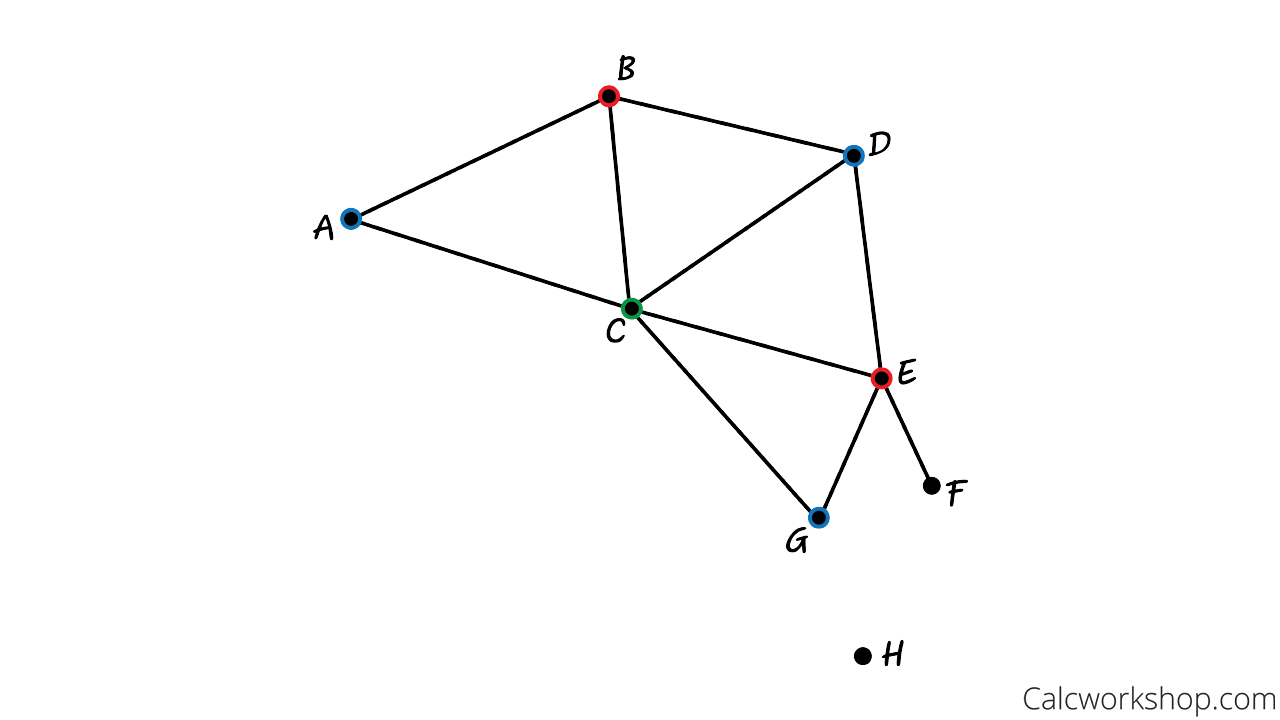
K Colorarble Dual Graph Example
Finally, we’ve got vertices F and H.
F only shares a border with E, so we can go wild with blue or green. Let’s go with green for variety.
As for vertex H, our lone island, it can be any of the three colors already used. We’ll stick with red.
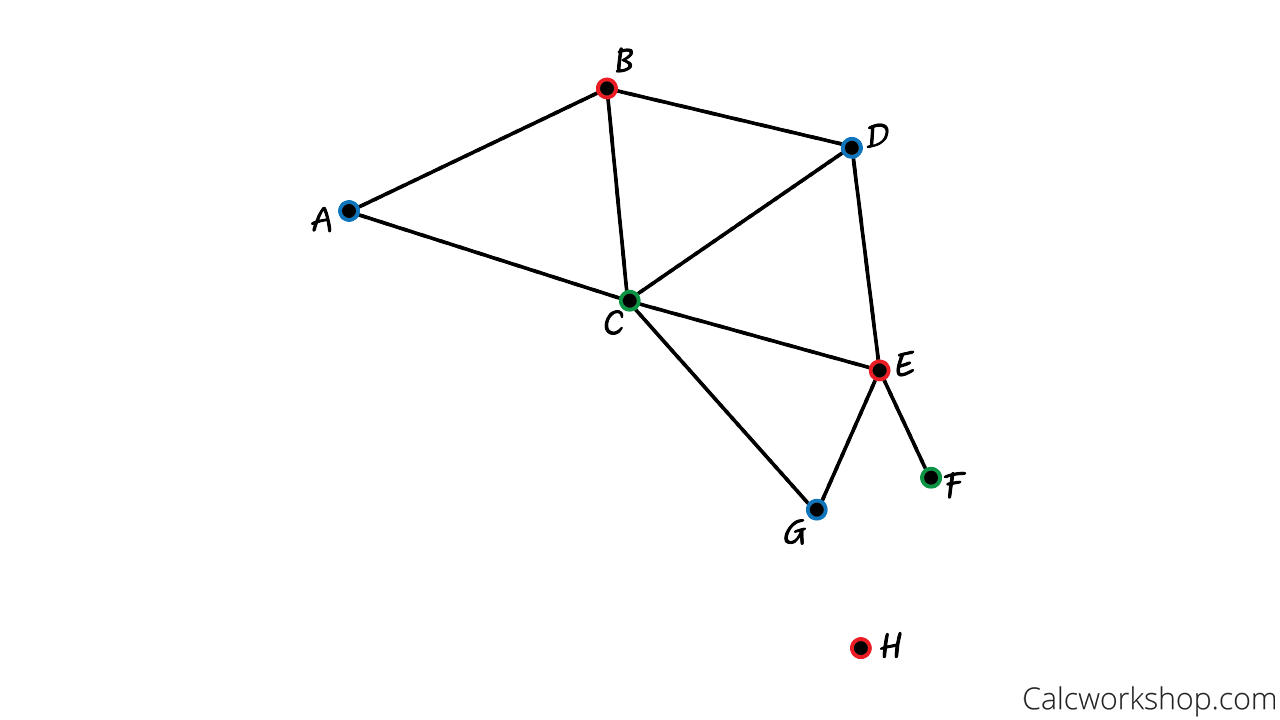
Assign Colors Dual Graph Example 3
Voilà! We’ve got our beautifully colored map of Australia, and we only needed three colors to do it. That makes Australia a 3-colorable country.
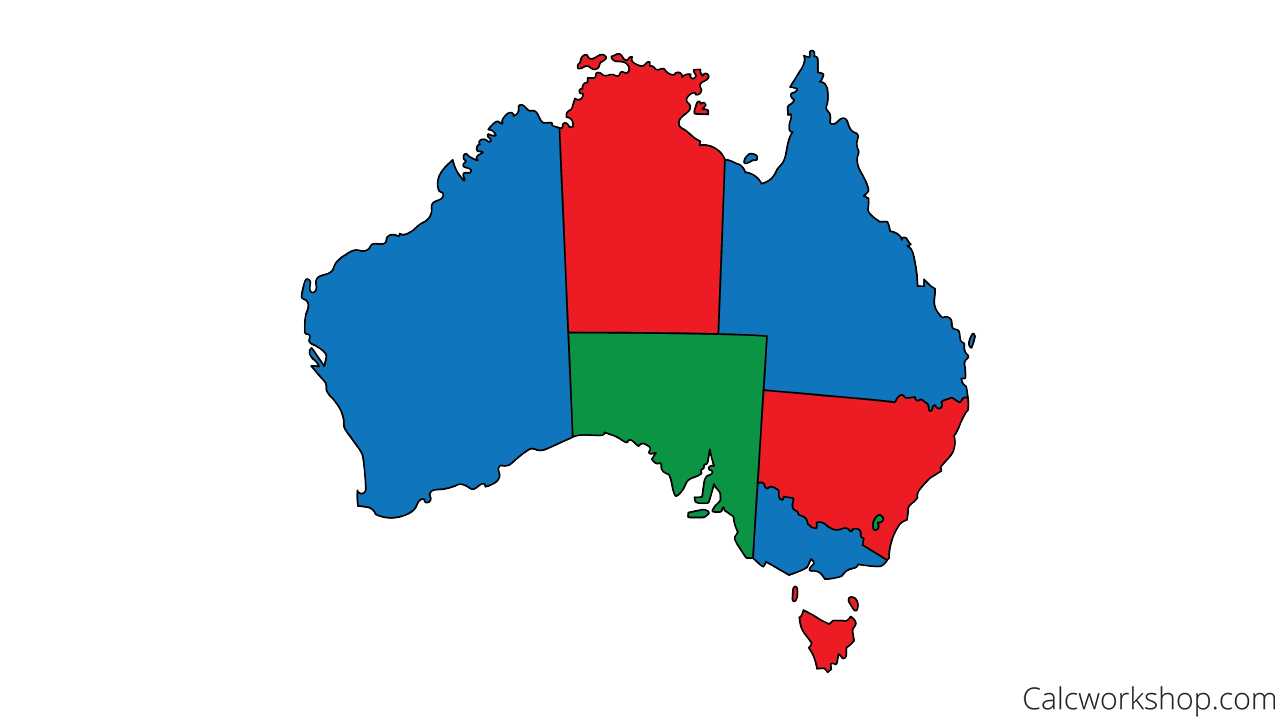
Chromatic Number Map Australia
The Four Color Theorem: A Controversial Mathematical Marvel
Hold on, it gets even better!
Did you know the minimum number of colors needed to color any planar graph is four?
That’s right, the Four Color Theorem says that the chromatic number of a planar graph (the least number of colors required) is no more than four.
Mind blown yet?
However, there’s a catch. (there’s always a catch it seems)
The proof of the Four Color Theorem is, well, controversial.
First released in 1879 by Alfred Kempe, the publication was riddled with mistakes. However, in 1976, Kenneth Appel and Wolfgang Haken successfully solved the problem by examining an astonishing 1,936 cases and employing the power of computers!
Gasp!
This raised eyebrows in the math world, as computers were considered a big no-no for proofs.
The Five Color Theorem: A Less Disputed Alternative
Over the years, the proof has been shortened to around 600 cases, but it still relies on computers. As a result, some mathematicians prefer the easily proven Five Color Theorem, which states that a planar graph can be colored with five colors.
Regardless of which theorem you root for, one thing is sure: planar graphs can be colored with five or fewer colors.
Coloring Nonplanar Graphs: Embracing Complexity
And what about nonplanar graphs? While we can’t pinpoint the exact number of colors needed, we can still use our mad coloring skills to make those graphs as efficient as possible.
In fact, graph coloring has a ton of real-world applications, from scheduling final exams to organizing TV channels, managing index registers, and even assigning habitats for our furry friends.
Wrapping Up…
Now, it’s your turn to unleash your inner artist and explore the captivating world of graph coloring.
Together, we’ll explore the chromatic wonders of graph coloring, making our world more efficient and maybe even a bit more colorful.
Video Tutorial w/ Full Lesson & Detailed Examples

Get access to all the courses and over 450 HD videos with your subscription
Monthly and Yearly Plans Available
Still wondering if CalcWorkshop is right for you?
Take a Tour and find out how a membership can take the struggle out of learning math.