Is it possible to draw a graph without any edge crossings?

Jenn, Founder Calcworkshop®, 15+ Years Experience (Licensed & Certified Teacher)
Yes.
A planar graph is a graph that can be drawn in the plane without any edges crossing and have some really cool mathematical properties, much like the tree graphs in our other lessons.
The Practical Applications of Planar Graphs
But why should we care?
Well, in highway construction, if two roads cross, there must be a stop sign or traffic signal, or routes must be run at different heights (tunnel, bridge, or overpass).
The building engineers must arrive at a solution that will either result in:
- Traffic delays due to the implementation of a stop sign or traffic signal
- Manufacturing delays due to the construction of a tunnel or overpass
And let’s not forget the expense needed for such an undertaking.
So, wouldn’t it be easier if we could find a solution where neither scenario was needed? In other words, is there a way to avoid crossing altogether?
The answer can be found with a planar representation.
Planar graphs help us avoid the hassle and expense of unnecessary edge crossings by helping us construct a graph or network where edges don’t cross.
And planarity doesn’t just help with traffic problems but also with circuit designs, utility lines, assignment and exam scheduling, and much more.
Let’s find out how!
Understanding Plane Graphs and Planar Representations
Alright, so a graph is called planar if it can be drawn in the plane without any edge crossings. And a plane graph is a planar graph that has been drawn in the plane without any edge crossings.
Confused? Look at the image below.
The graph on the left is a graph that currently has edge crossings. But, if we redraw the graph, so the edges no longer cross, as depicted by the graph on the right, it is called a plane graph because we have shown the original graph to be planar.
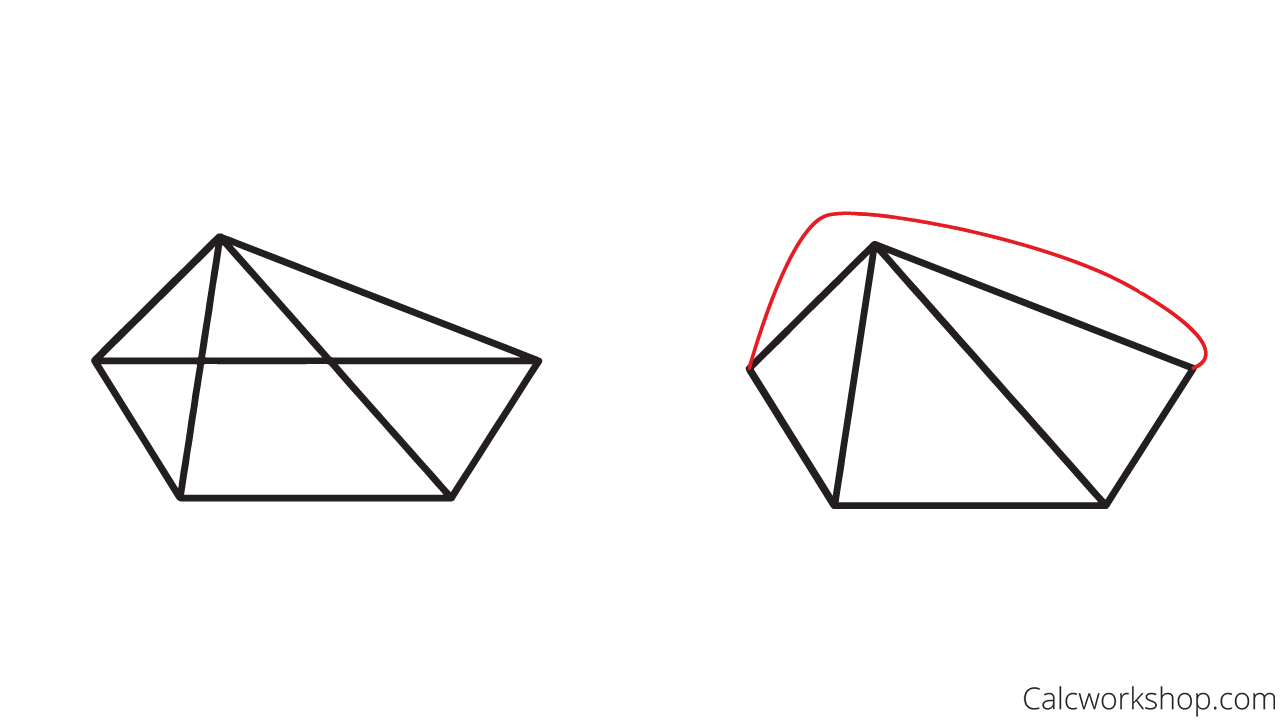
Planar Graph Drawn Without Crossings
Euler’s Formula and its Role in Planar Graphs
And a planar representation of a graph splits or divides the plane into regions. For example, using our model above, notice how the plane is divided into five regions, including the unbounded region representing the space outside the graph.
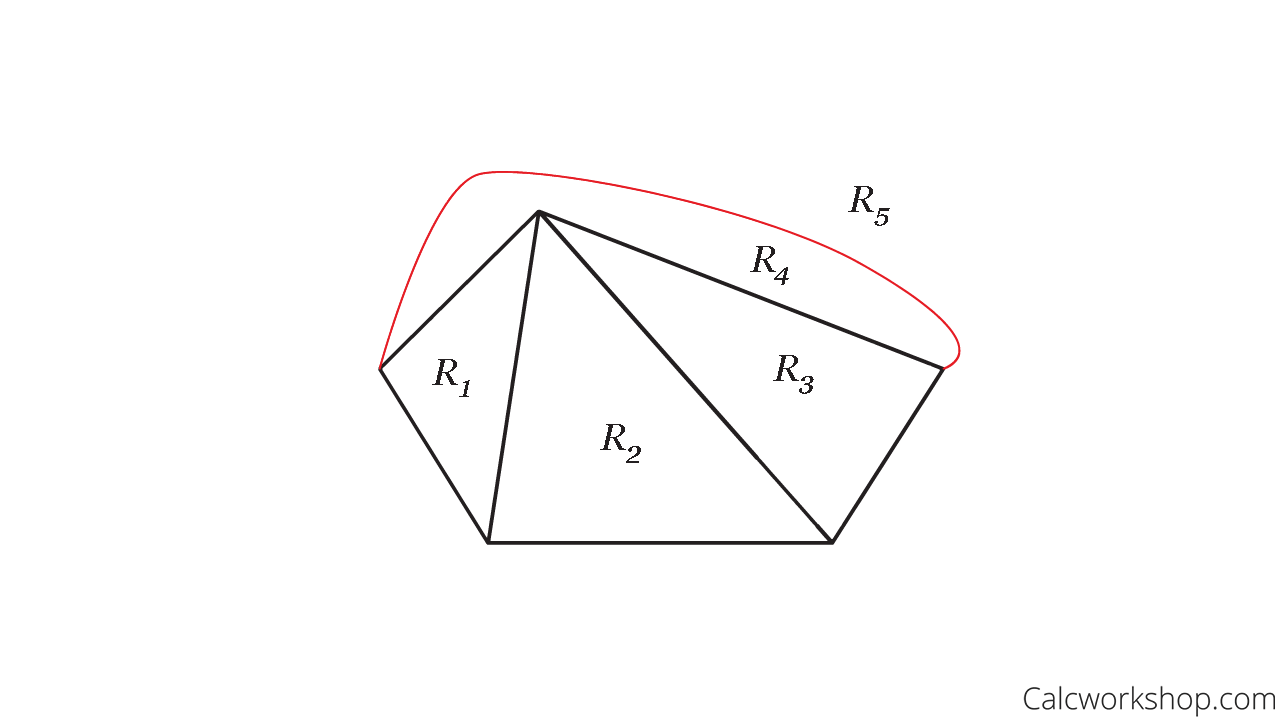
Planar Graph Regions
But here’s the amazing part.
Euler’s formula tells us that if G is a connected planar simple graph with E edges and V vertices, then the number of regions, R, in a planar representation of G is:
\begin{equation}
R=E-V+2 \quad \text { or } \quad R-E+V=2
\end{equation}
Let’s illustrate Euler’s formula with our example.
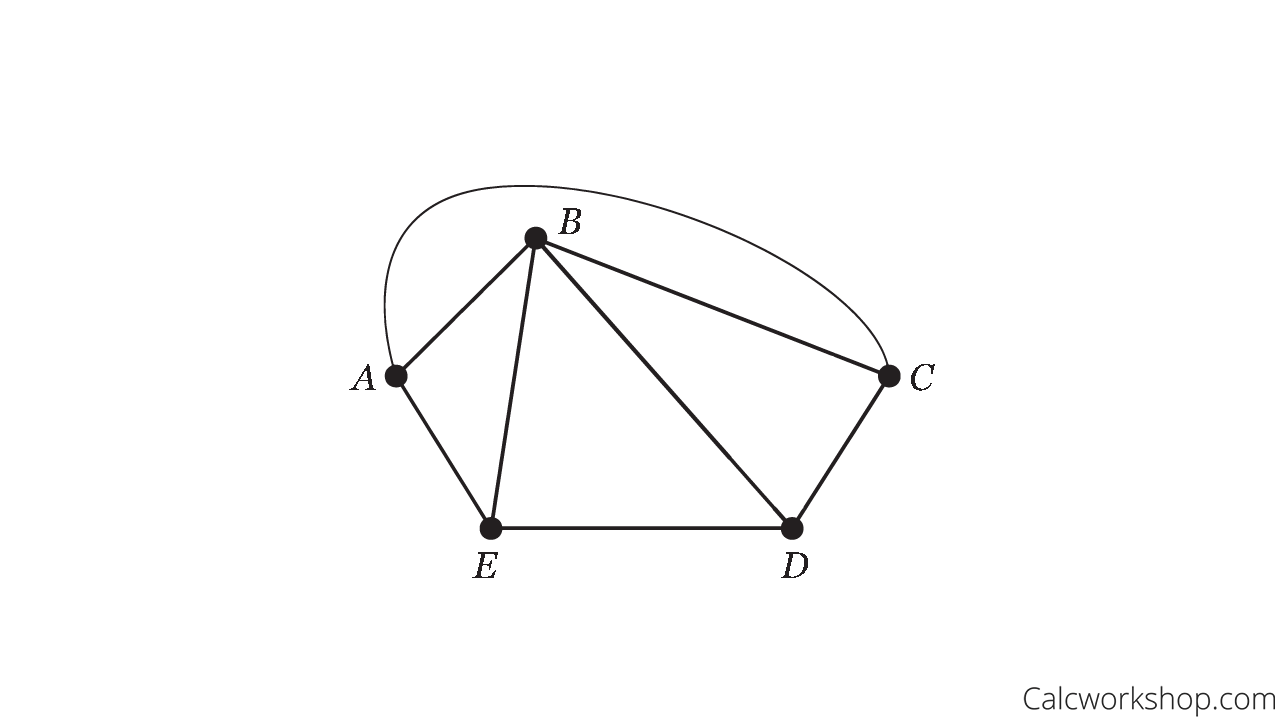
Eulers Formula Example
There are eight edges (E=8), five vertices (V=5), and five regions (R=5). Thus,
\begin{equation}
R-E+V=5-8+5=2
\end{equation}
Which verifies Euler’s formula!
Planar graphs are so cool, right?!
Exploring Nonplanar Graphs: \(K_5\) and \(K_{3,3}\)
But now it’s time to look at nonplanar graphs. The most famous is the complete graph \(K_5\) and the complete bipartite graph \(K_{3,3}\).
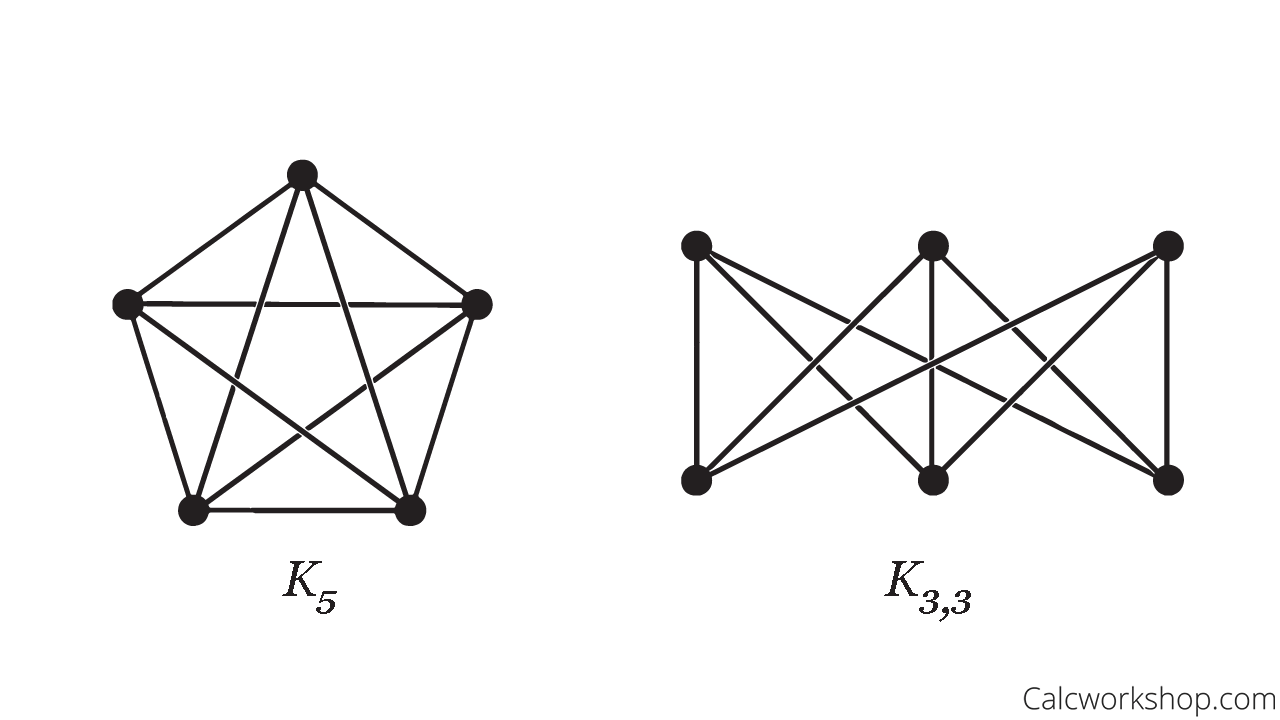
Nonplaner Bipartite Graphs
Kuratowski’s Theorem: Identifying Nonplanar Graphs
What makes these two graphs nonplanar?
Well, there is no way to redraw either of these graphs without having at least one edge crossing, which we will see in our video when we work through an informal proof.
But here’s what’s impressive, Kuratowski’s Theorem states that a graph is nonplanar if and only if it contains a subgraph homeomorphic to \(K_5\) or \(K_{3,3}\).
In other words, if we can show that hidden inside a graph is either a \(K_5\) or \(K_{3,3}\) subgraph, then the overall graph is nonplanar!
The Concept of Homeomorphism in Graph Theory
Okay, that seems doable, right? But what’s homeomorphic mean?
Two graphs are homeomorphic if we can establish a continuous bijection between their points in both directions. Notably, two graphs G and H, are homeomorphic if they can be obtained from the same graph by a sequence of elementary subdivisions.
Come again?
All this means is that if we have a degree two node, we can “smooth” it out to make a single edge.
For example, the two graphs below are considered homeomorphic.
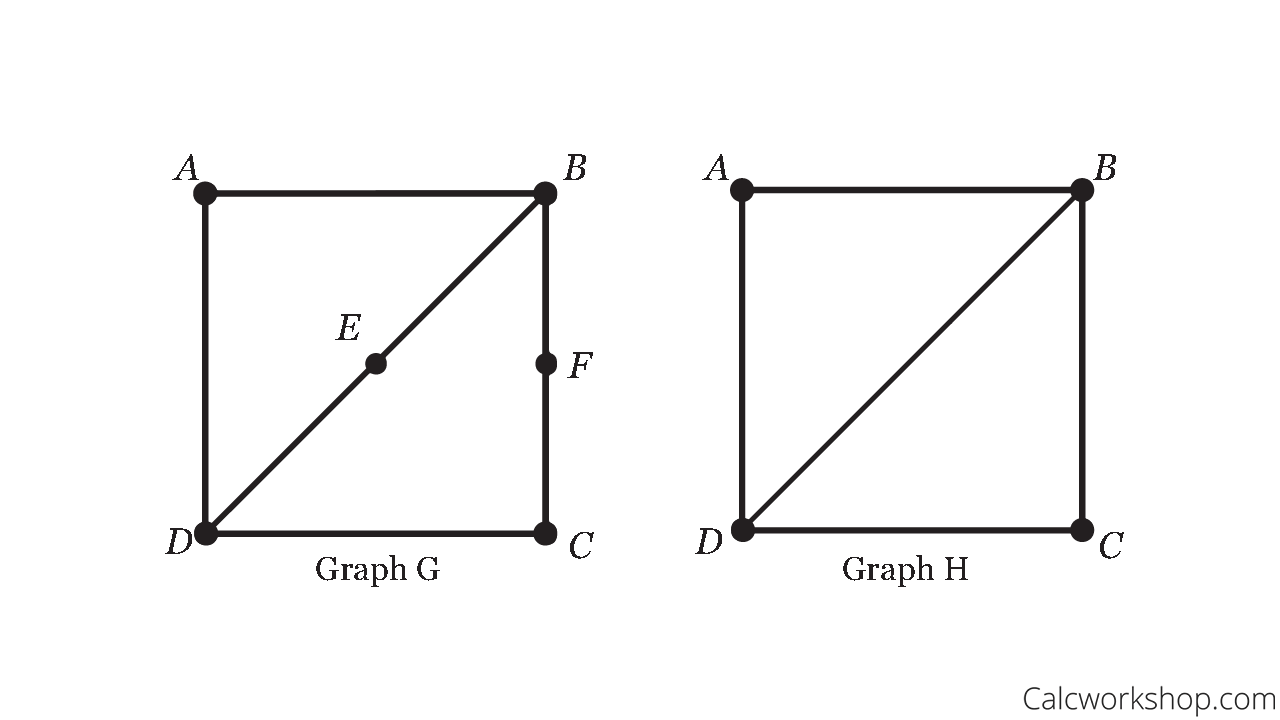
Homeomorphic Graphs Example
Notice how the vertices E and F are both degree 2 in the graph on the left, so we can “smooth” them out to make one single edge seen in graph H.
Why is this important?
Because homeomorphism helps show graph equivalence.
And by using this concept, we can demonstrate how nonplanar graphs have a copy of either \(K_5\) or \(K_{3,3}\) hidden inside.
Summing Up
Don’t worry. This will all make more sense once we work through an informal proof of Kuratoski’s theorem while looking at the famous Petersen graph and various others.
So, together we will learn how to:
- Draw a planar graph
- Use Euler’s formula to determine how many regions a plane is divided by a planar representation
- Use Kuratoski’s theorem to determine if a given graph is planar or nonplanar
Let’s jump right in!
Video Tutorial w/ Full Lesson & Detailed Examples
Get access to all the courses and over 450 HD videos with your subscription
Monthly and Yearly Plans Available
Still wondering if CalcWorkshop is right for you?
Take a Tour and find out how a membership can take the struggle out of learning math.