What if I told you that there is a way to take the graph of the derivative and quickly draw the graph of the original function?

Jenn, Founder Calcworkshop®, 15+ Years Experience (Licensed & Certified Teacher)
Well, the secret to understanding a graph lies in properly labelling it and learning how to read it.
But it’s best to learn how through exploration.
Derivative Graph Rules
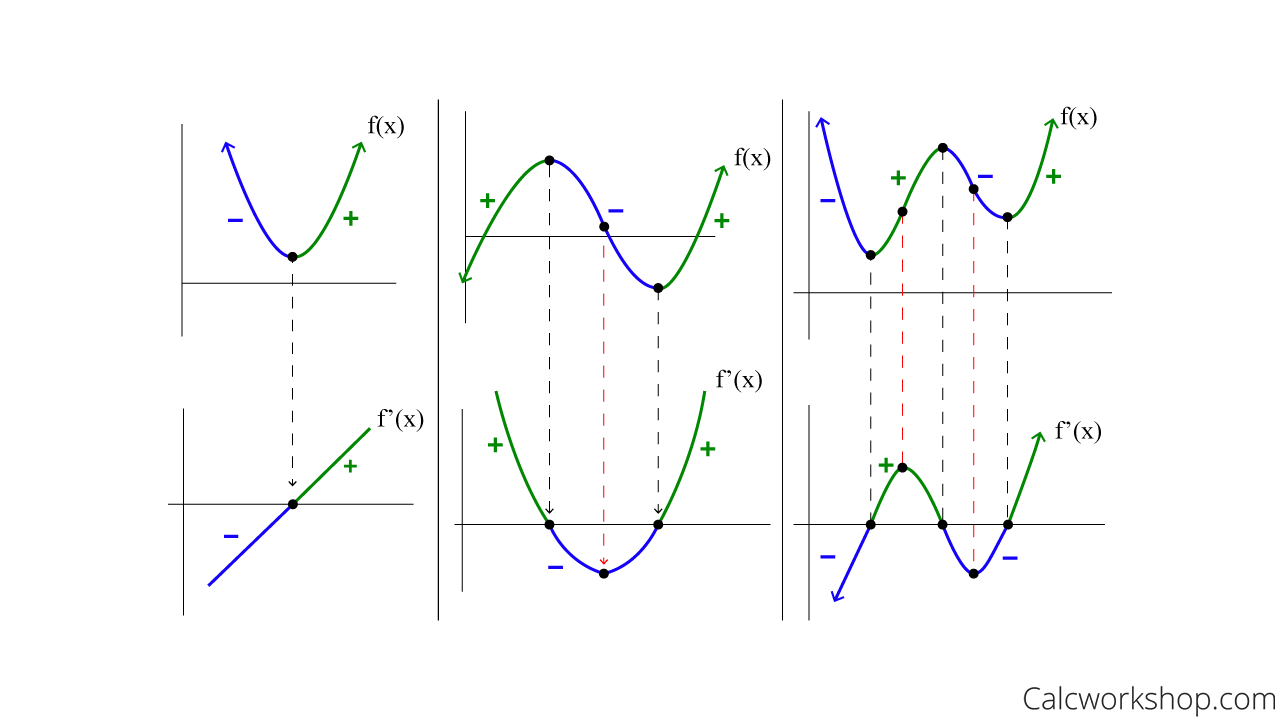
Below are three pairs of graphs. The top graph is the original function, f(x), and the bottom graph is the derivative, f’(x).

Graph Of Derivative To Original Function
What do you notice about each pair?
- If the slope of f(x) is negative, then the graph of f’(x) will be below the x-axis.
- If the slope of f(x) is positive, then the graph of f’(x) will be above the x-axis.
- All relative extrema of f(x) will become x-intercepts of f’(x).
- All points of inflection of f(x) will become relative extrema of f’(x).
Additionally, if f(x) is an odd function, then f’(x) is an even function. And if f(x) is an even function, then f’(x) is an odd function. This means that the derivative will more than likely have one less turn than the original function.
Cool, right?
So, graphing the derivative when given the original function is all about approximating the slope.
How To Read Derivative Graphs
Alright, this seems simple enough, but what do we do if we are given the derivative graph, and we want to find the original function?
So glad you asked!
Once again, you just need to know what to look for!
\begin{equation}
\begin{array}{|l|l|l|}
\hline f^{\prime}(x)>0 & \rightarrow & f(x) \text { is increasing } \\
\hline f^{\prime}(x)<0 & \rightarrow & f(x) \text { is decreasing } \\
\hline f^{\prime}(x) \text { changes from negative to positive } & \rightarrow & f(x) \text { has a relative minimum } \\
\hline f^{\prime}(x) \text { changes from positive to negative } & \rightarrow & f(x) \text { has a relative maximum } \\
\hline f^{\prime}(x) \text { is increasing } & \rightarrow & f(x) \text { is concave upward } \\
\hline f^{\prime}(x) \text { is decreasing } & \rightarrow & f(x) \text { is concave downward } \\
\hline f^{\prime}(x) \text { has an extreme value } & \rightarrow & f(x) \text { has a point of inflection } \\
\hline
\end{array}
\end{equation}
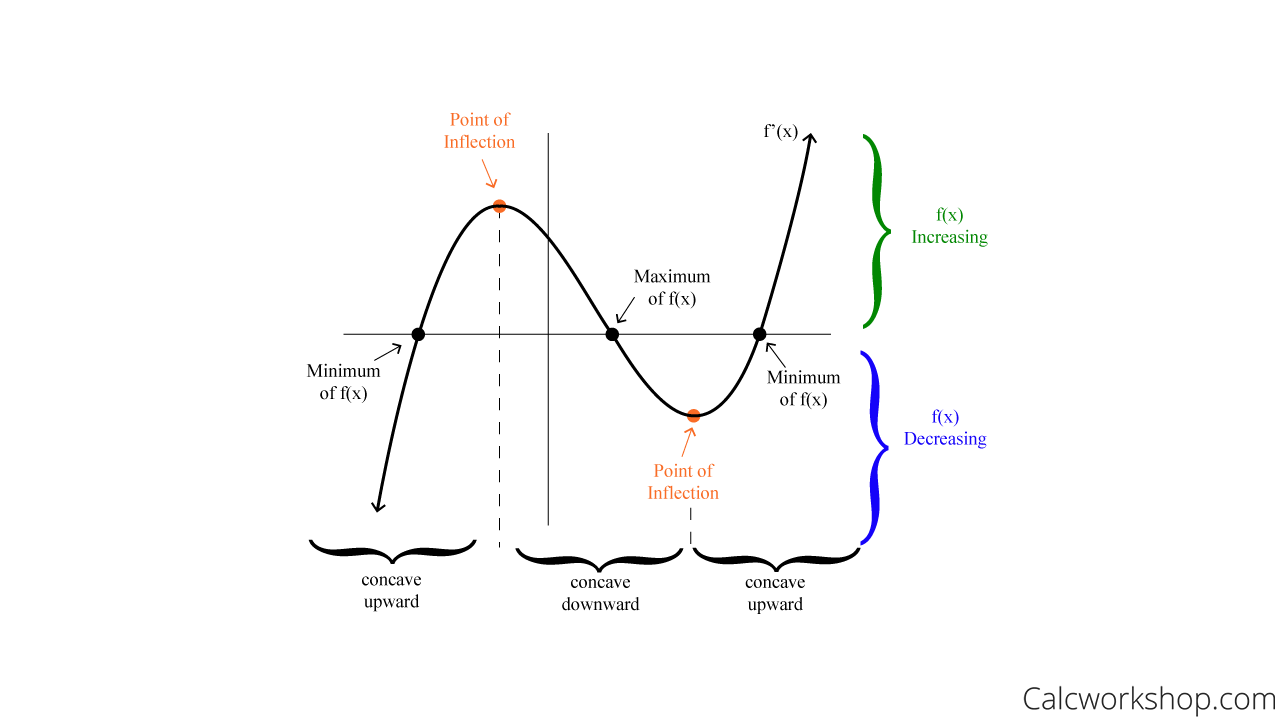
Let’s make sense of this table with a picture. Again, the key to understanding how to analyze the graph of the derivative is to mark up the graph, as indicated below.

How To Find Original Function From Derivative Graph

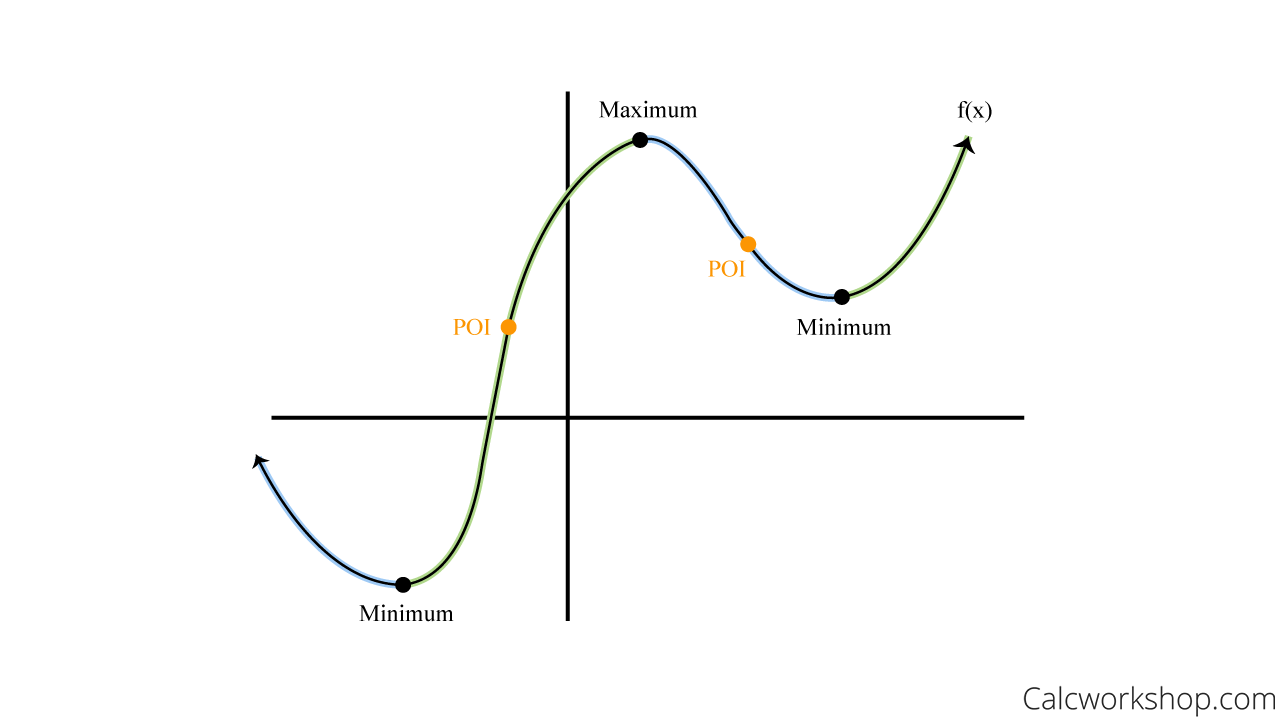
Estimated Function Graph
With the help of numerous examples, we will be able to plot the derivative of an original function and analyze the original function using the graph of the derivative.
Trust me, it’s straightforward, and you’ll get the hang of it in no time.
Let’s get to it!
Video Tutorial w/ Full Lesson & Detailed Examples (Video)

Get access to all the courses and over 450 HD videos with your subscription
Monthly and Yearly Plans Available
Still wondering if CalcWorkshop is right for you?
Take a Tour and find out how a membership can take the struggle out of learning math.