Did you know that the relationship between sets can be explained using relations?

Jenn, Founder Calcworkshop®, 15+ Years Experience (Licensed & Certified Teacher)
In Algebra, we learned that a relation is a set of ordered pairs. The first elements (x-coordinates) represented the input or domain and the second elements (y-coordinates) represented the output or range. In other words, x is associated with or “related” to y.
This means we can expand upon this idea as it relates to set theory.
A relation is an association or connection between the elements of one set and another. There are several types of relations that we will be studying throughout this unit, namely:
- Binary Relations — Connection between objects
- Equivalence Relations — Breaking objects into groups
- Partial Order — Ranking objects
What Is A Binary Relation
Formally, a binary relation from set A to set B is a subset of A X B. For any pair (a,b) in A X B, a is related to b by R, denoted aRb, if an only if (a,b) is an element of R.
But that seems overly confusing, doesn’t it?
Let’s make this easier to understand. A relation shows an association of objects from one set with objects from other sets or even the same set. It indicates a relationship. And we represent this relationship or association as an ordered pair.
For example, suppose we set of people and our relation (i.e., the way one person is associated with another person) is if they have the same first name. So, person “a” is related to person “b,” denoted (a,b) or aRb, if a and b have the same first name.
See, relations aren’t so bad…they just identify association or a relationship between objects, or in this case, people’s names!
With this in mind let’s rework our formal definition so it makes a bit more sense.
A binary relation from a set A to a set B is a set of ordered pairs (a,b), where a is an element of A and b is an element of B and R is the relation, or identifying association, for every a and b.
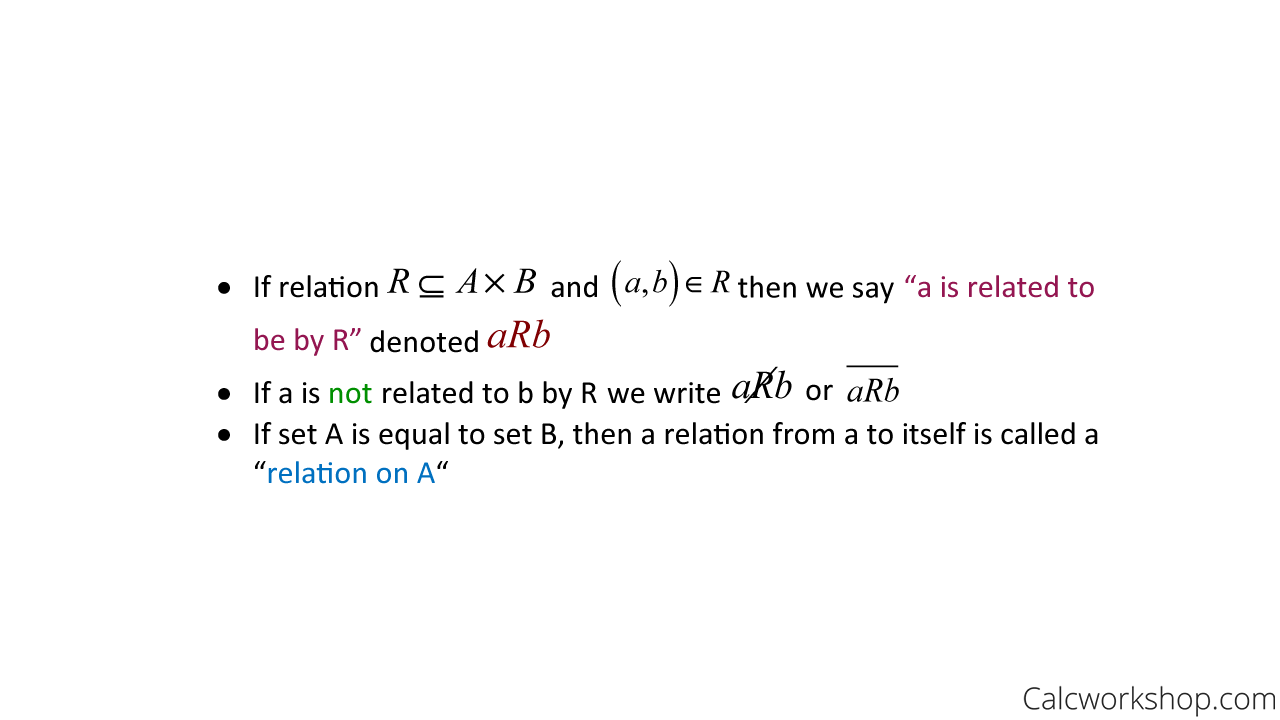
Relation Definition
While this definition may seem strange, please know that you are familiar with relations and have been using them for years, as the graphic below illustrates specific relationships between objects that you are undoubtedly acquainted with.

Types Of Mathematical Relationships
How To Find Relations
What this means is that we are familiar with relations. We will generalize these relationships by learning how to write and modeling them using matrices and directed graphs.
Example
Suppose set A = {1,2,3,4} and Set B = {0,2,4,6} and relation aRb such that a < b. Using the roster method, list the elements of R.
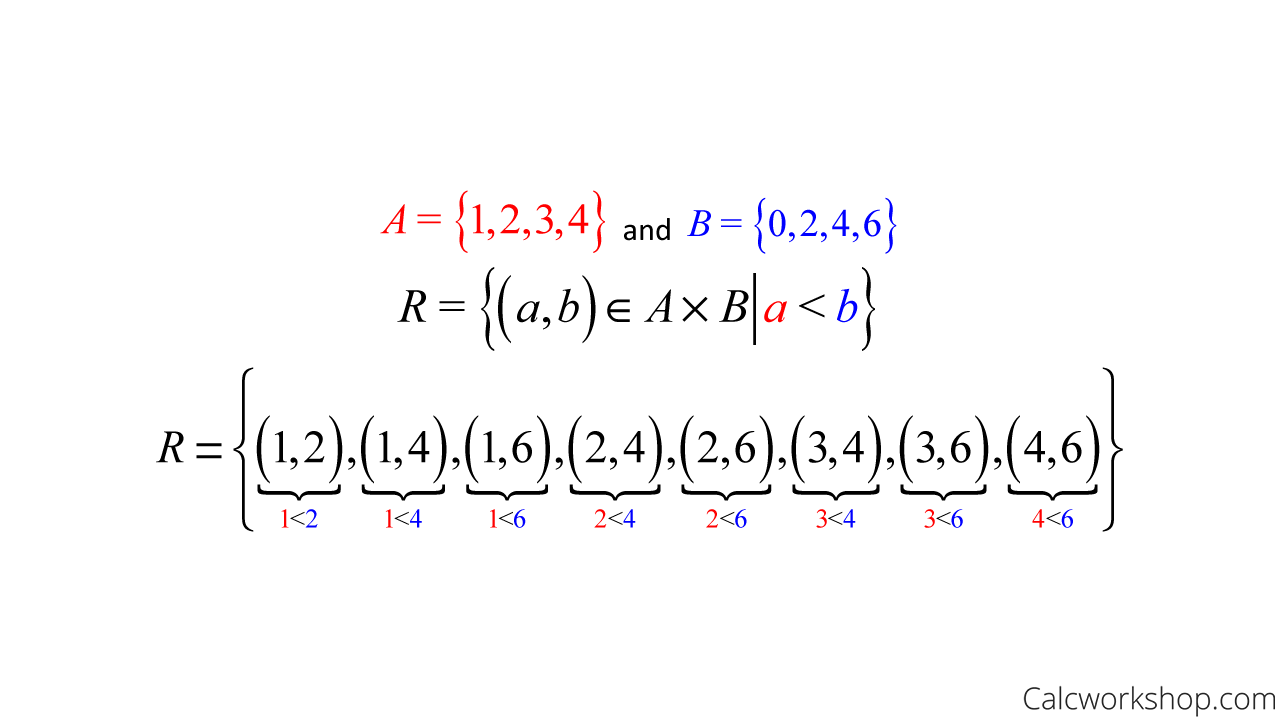
How To Write A Recurrence Relation
Combining Relations
It’s important to note that a relation from set A to set B is a subset of A x B.
For example, suppose there are 100 people in our group (set), and we want to find the relation of people with the same first name is a subset and the relation of people with the same birthdate. Both of these relations represent a smaller set (i.e., subset) of the original group of people.
But this now leads us to a fantastic application! Combination of subsets!
Notice that we just took one large set (group of 100 people) and created two separate subsets (relation A associates shared first names and relation B associates shared birthdates). Now we can combined these two sets to find the union, intersection, and difference as noted by Stanford.
Example
For example, assume set A = {0,1,2} and Set B = {0,1,2,3} and let relations R = {(0,0),(1,1), (2,2))} and T = {(0,0),(0,1),(0,2),(0,3)}.
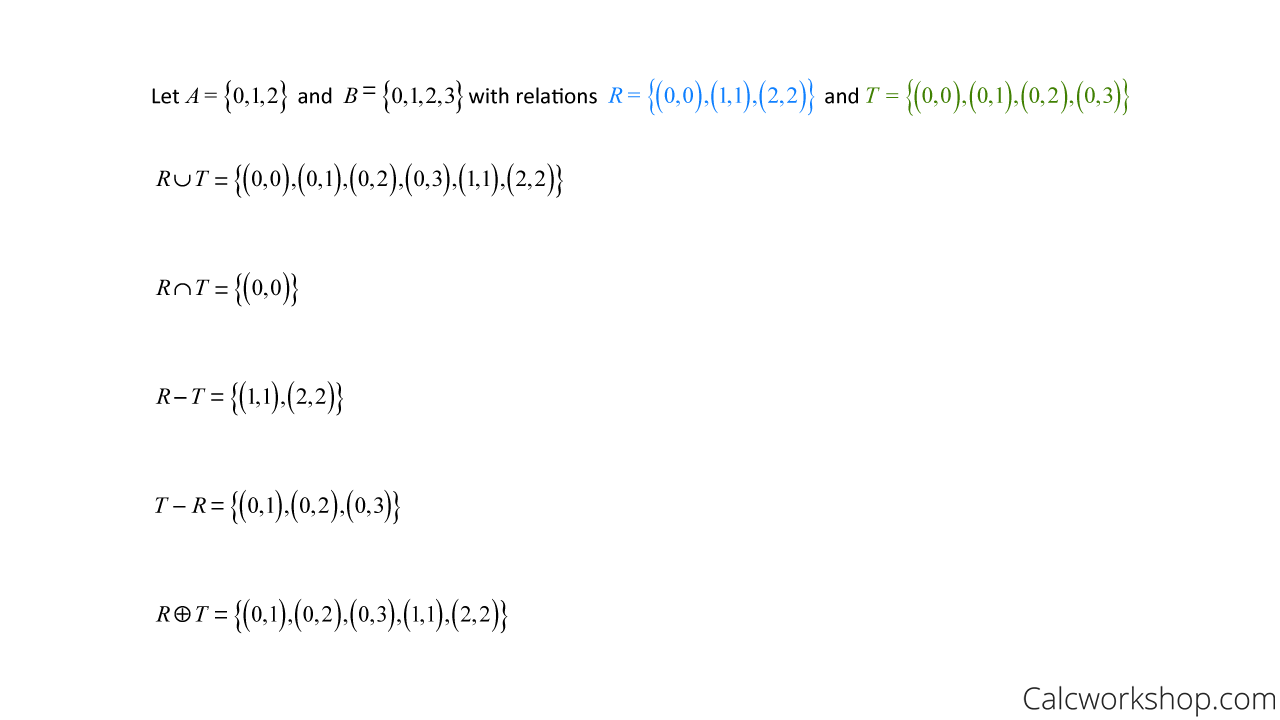
Combining Relations
Additionally, we are also able to find the composition, inverse, and powers of relations.
If R is a relation from set A to set B and T is a relation from set B to set C, then the composite of R and T is the relation consisting of ordered pairs (a,c) where a is an element of set A and c is an element of set C for which there exists an element b in set B.
To find composite relations, all we have to do is match the second element of the first relation with the first element of the second relation and write the remaining ordered pair.
Example
For example, let’s say we have (2,3) and (3,5). Notice that the second element “3” of the first ordered pair matches the first element “3” of the second ordered pair. Well, if we “eliminate” the matching components, the composite of these two points would be (2,5).
Example
For example, suppose we let A = {1,2,3} , B = {0,1,2}, and C = {a,b}. If T = {(0,b),(1,a),(2,b)} is a relation from B to C and R = {(1,0),(2,2),(3,1),(3,2)} is a relation from A to B, the the composite of the relations T and R is found by matching the range (2nd elements) of R with the domain (1st elements) of T.
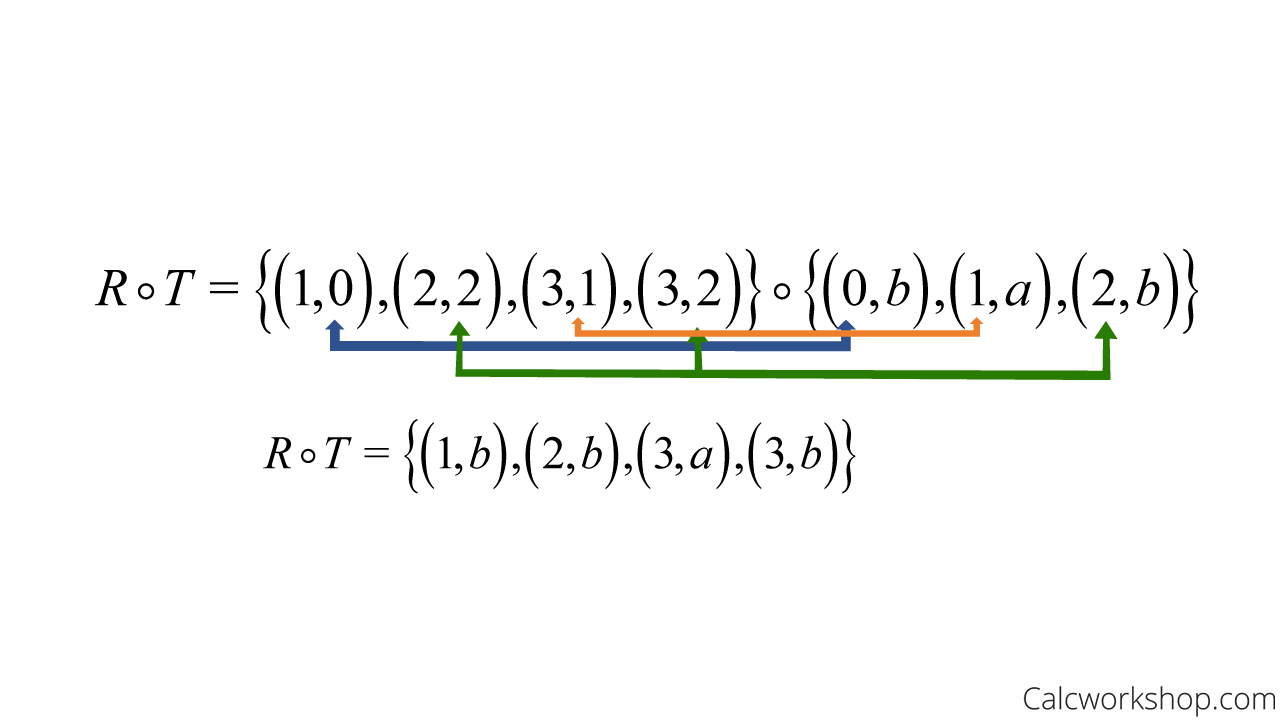
Relation Composition
And with the ability to determine composition, we can find powers of a relation using the following definition:

Powers of Relation R — Definition
Graphing Relations
Now that we’ve seen how to represent a relation using the roster method and how to combine relations using known set operations, it’s time to see how we can display relations graphically using Incidence Matrices and Directed Graphs.
Incidence Matrix
In algebra we learned that a matrix is a rectangular array of numbers with m rows and n columns, denoted m x n.
So, if we let A and B be nonempty finite sets and R is a relation from A to B, and we determine the cardinality of each set so that |A| = m and |B| = n, then R can be represented with an m x n Boolean matrix, typically called an incidence matrix, defined by
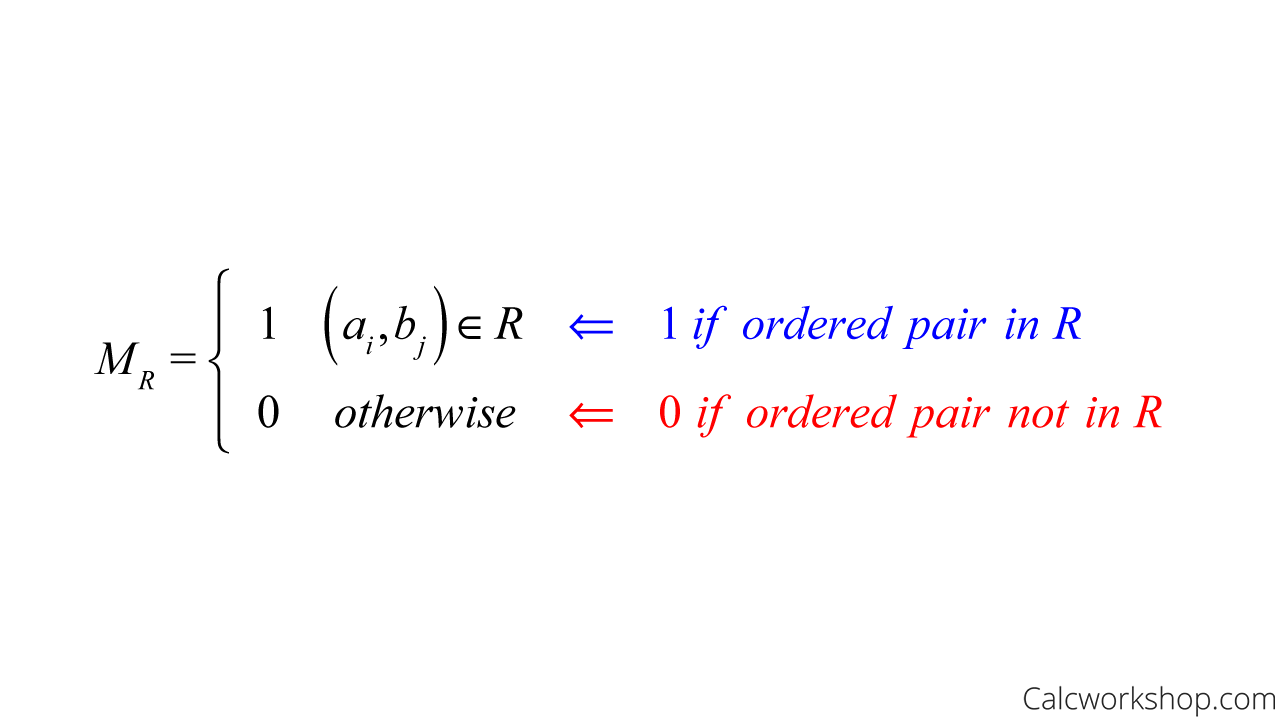
Zero One Matrix — Definition
Using a previous example where set A = {1,2,3,4} and set B = {0,2,4,6} with relation aRb such that a < b, we found that R = {(1,2),(1,4),(1,6),(2,4),(2,6),(3,4),(3,6),(4,6)}. This relation can be displayed as an incidence matrix shown below
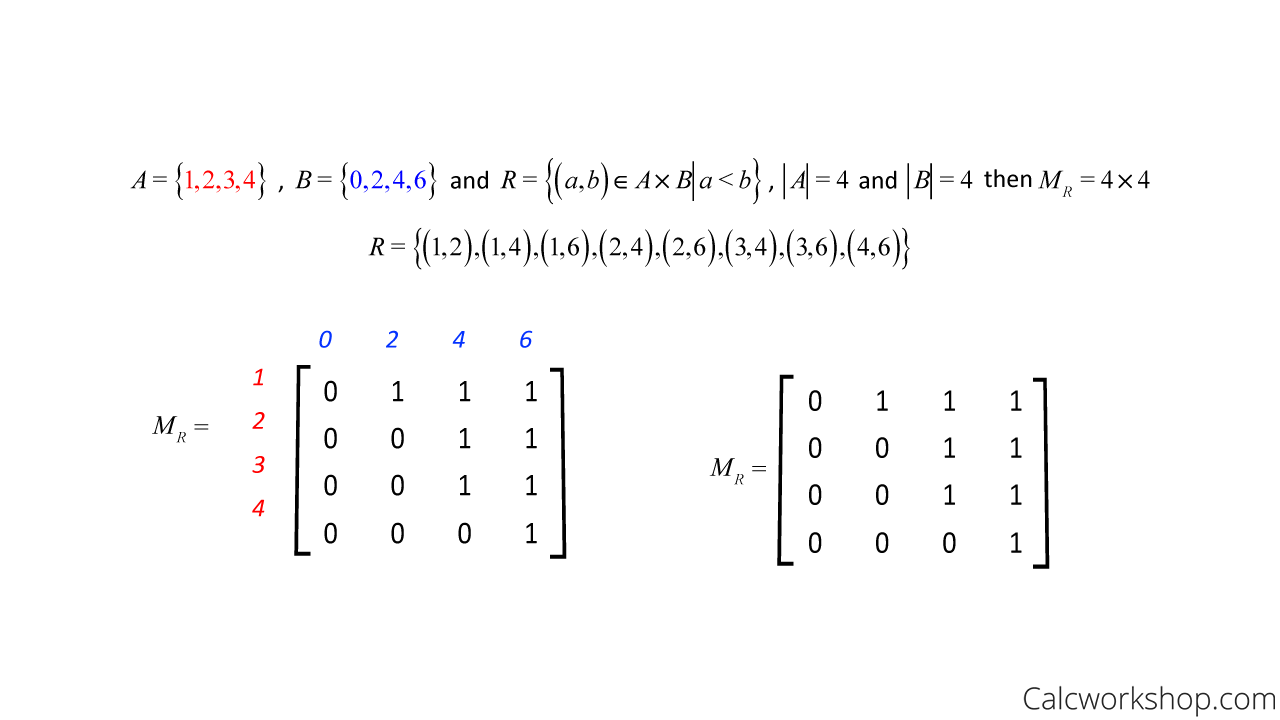
Incident Matrix
Notice, for example, that since the point (1,2) is in the relation R, then the spot in the matrix that corresponds to row 1 and column 2 meet has a 1. Whereas, the point (4,4) is not in the relation R; therefore, the spot in the matrix that corresponds to row 4 and column 4 meet has a 0.
Directed Graph
Lastly, a directed graph, or digraph, is a set of objects (vertices or nodes) connected with edges (arcs) and arrows indicating the direction from one vertex to another. This means that each ordered pair in relation to R becomes a directional segment (edge) indicating the order of travel.
Remember, a relation demonstrates a relationship between objects; thus, a directed graph displays a set of objects (vertices) that relate to one another (edges).
Using our example above, we can display relation R = {(1,2),(1,4),(1,6),(2,4),(2,6),(3,4),(3,6),(4,6)} as a directed graph, where each element in R becomes a vertex, and a directed edge connects these vertices if they are an ordered pair in the relation, as shown below.
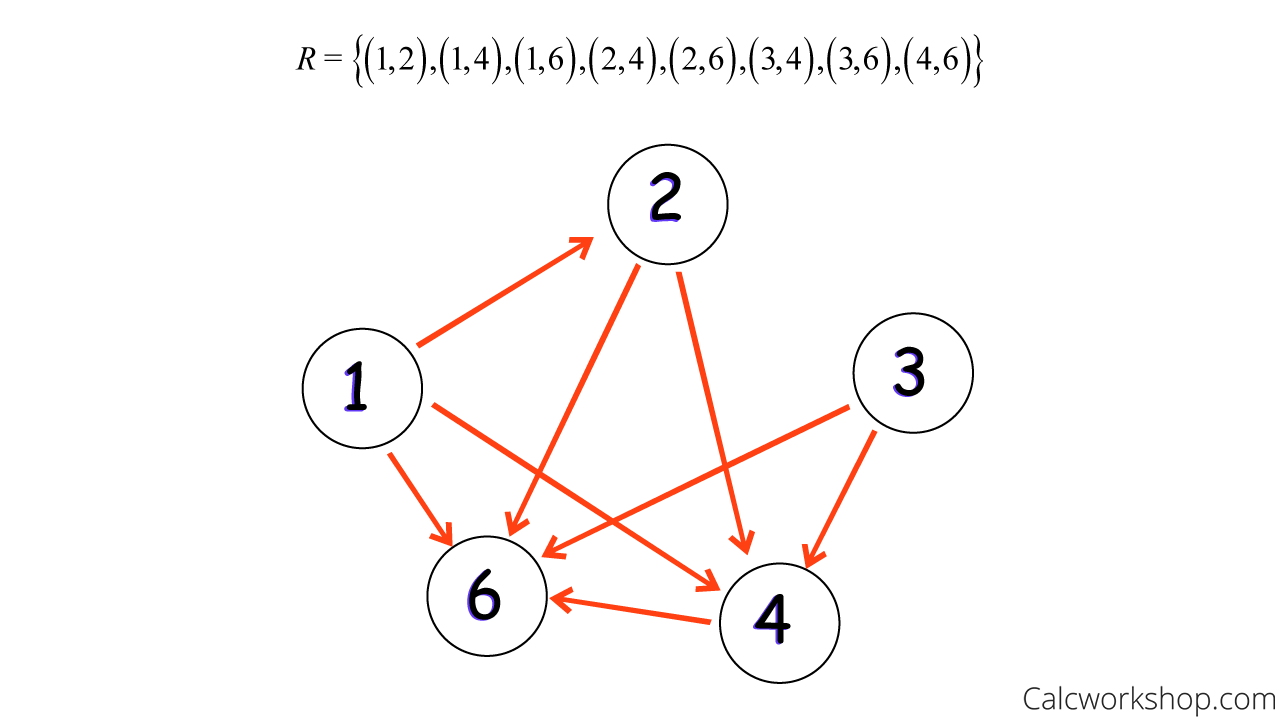
Directed Graph Example
Now suppose we have the relation T = {(1,1),(1,2),(1,3),(2,1),(2,2),(2,3),(3,1),(3,2),(3,3)}.
Notice that some of the ordered pairs have the same first and second elements. We depict this relationship with what is called a self-loop or loop. Furthermore, you will notice from the graph below that multiple directional edges come from the vertices; this is called a directions pseudograph.
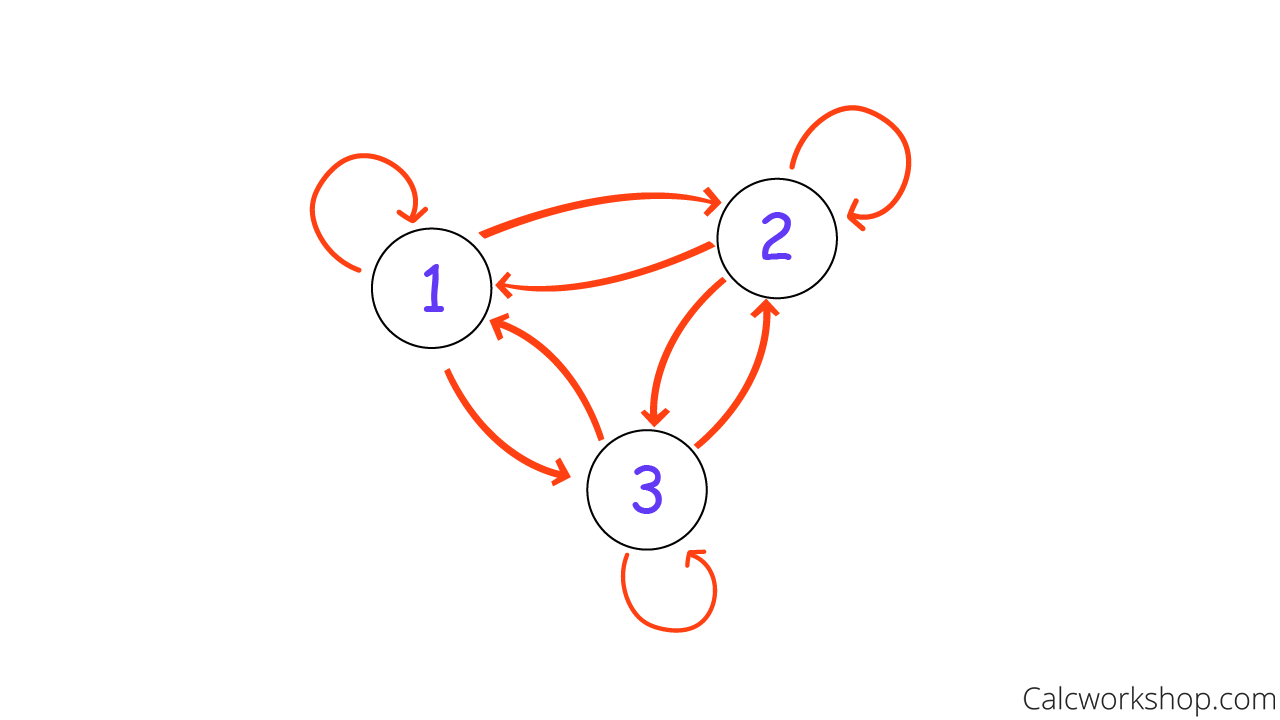
Pseudograph — Example
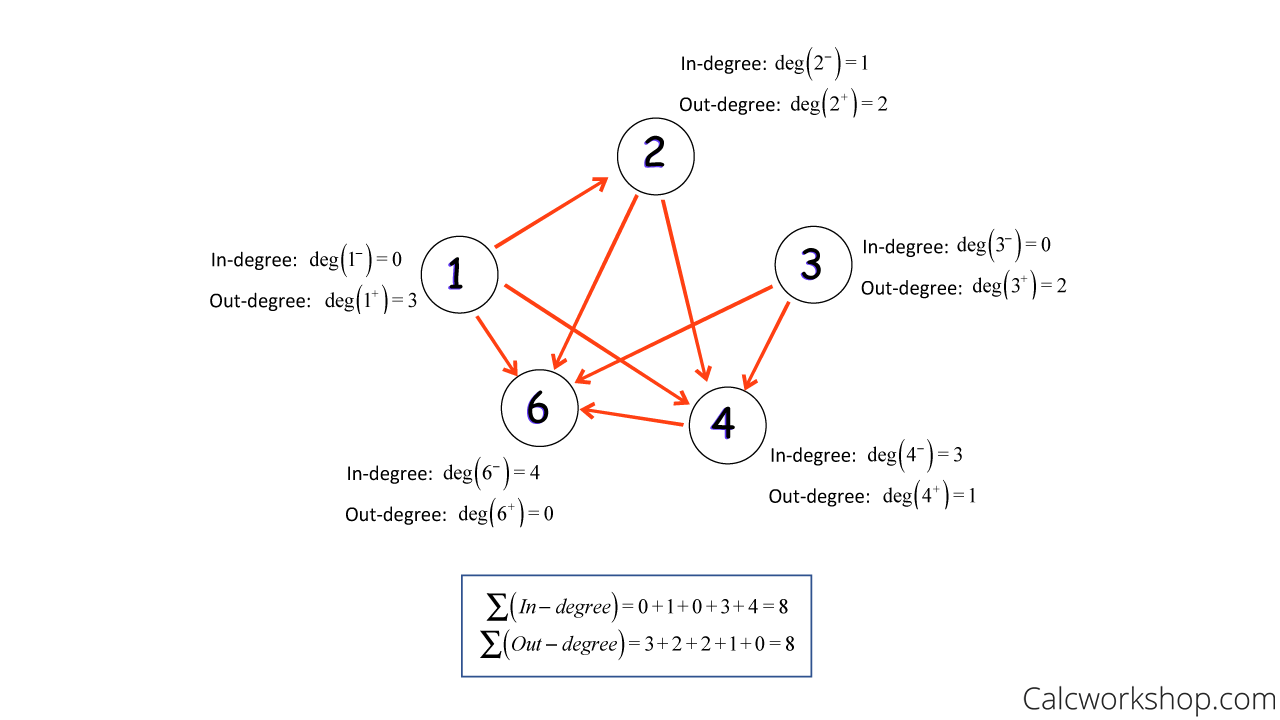
Additionally, we can further illustrate the association between objects using the In-Out-Degree Theorem. The in-degree of a vertex is the number of edges leading it, whereas the out-degree of a vertex is the number of edges leading away from it, and the sum of in-degrees is always equal to the sum of out-degrees.
Using the relation R = {(1,2),(1,4),(1,6),(2,4),(2,6),(3,4),(3,6),(4,6)}, we can see this theorem in action:
Degree Of A Graph
Together we will learn all about representing binary relations using the roster method, incidence matrix, and directed graph, as well as how to combine relations using set operations and so much more!
Let’s get to it.
Video Tutorial w/ Full Lesson & Detailed Examples
2 hr 9 min
Get access to all the courses and over 450 HD videos with your subscription
Monthly and Yearly Plans Available
Still wondering if CalcWorkshop is right for you?
Take a Tour and find out how a membership can take the struggle out of learning math.