Do you know how to find the population mean?

Jenn, Founder Calcworkshop®, 15+ Years Experience (Licensed & Certified Teacher)
Well, it all depends on whether or not you are given the population standard deviation or not.
If you have the standard deviation or mu, then it’s pretty straightforward using the formulas you already know from previous lessons.
However, if mu is unknown, it gets tricky and requires a t-table to move forward.
And that’s exactly what we’re going to discuss today’s statistics lesson.
Let’s get after it!
Population Standard Deviation – Known vs Unknown
In that case, we will use a z-statistic and follow a standard normal distribution and z-table.
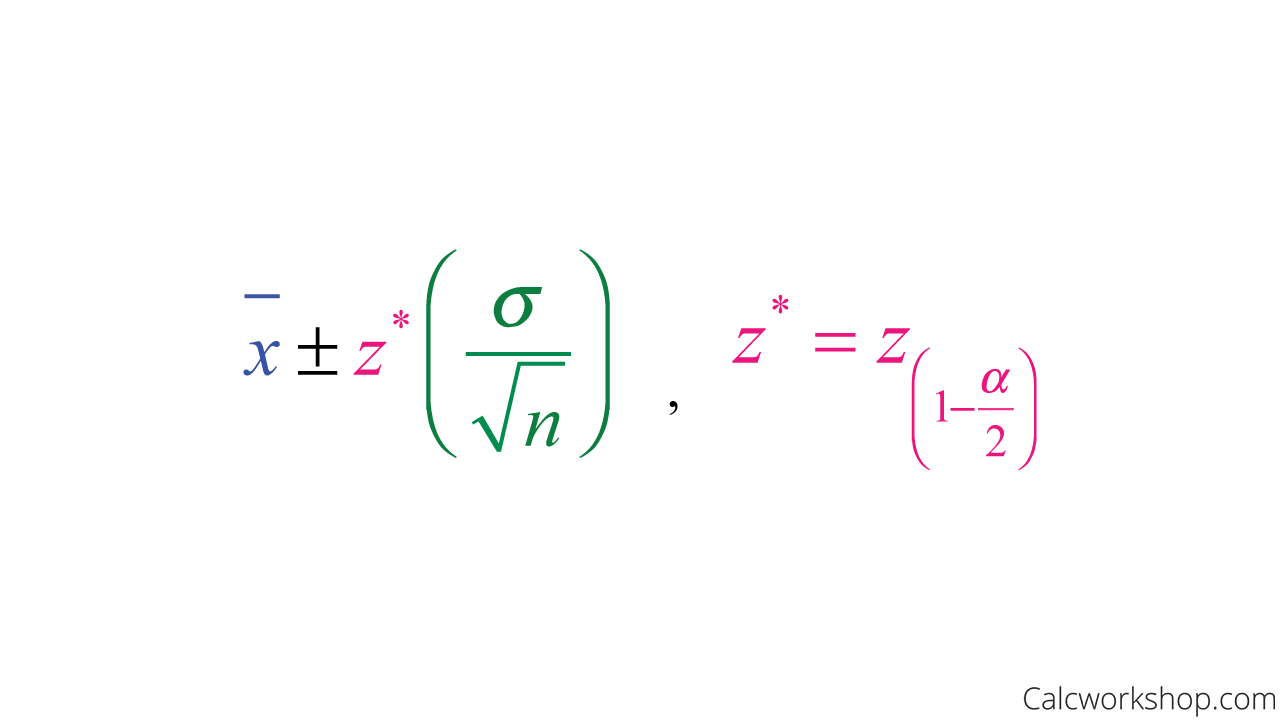
Confidence Interval Formula for Population Mean with Known Standard Deviation
However, it is somewhat unrealistic to know the population standard deviation as noted by OpenStax. When this happens, we will use the sample standard deviation when calculating the standard error because it is close enough to the unknown population standard deviation.
But this will also mean that we can no longer use a standard normal distribution.
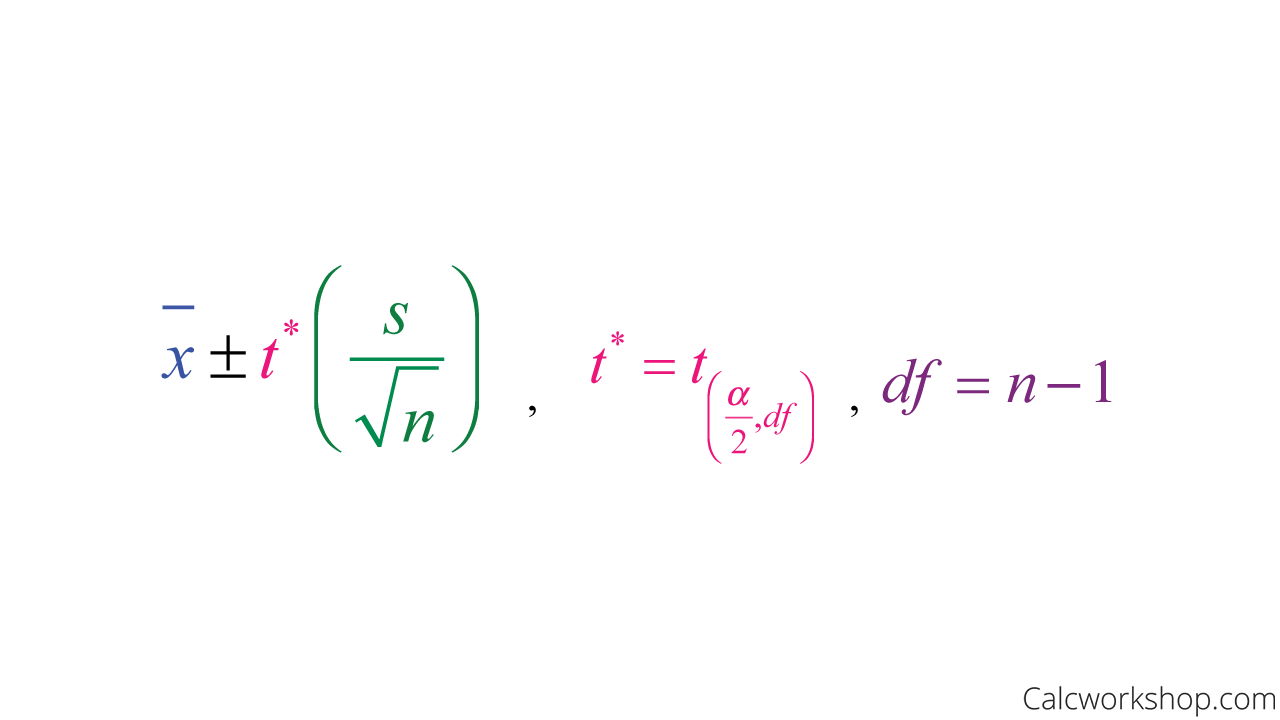
Confidence Interval Formula for Population Mean with Unknown Standard Deviation
T Distribution
The t-distribution is bell-shaped, similar to a standard normal distribution, but with a lower height and wider spread.
It should also be noted that as the sample size increases, the t-distribution improves and becomes more like a standard normal curve. Which means that the sampling distribution becomes normalized.
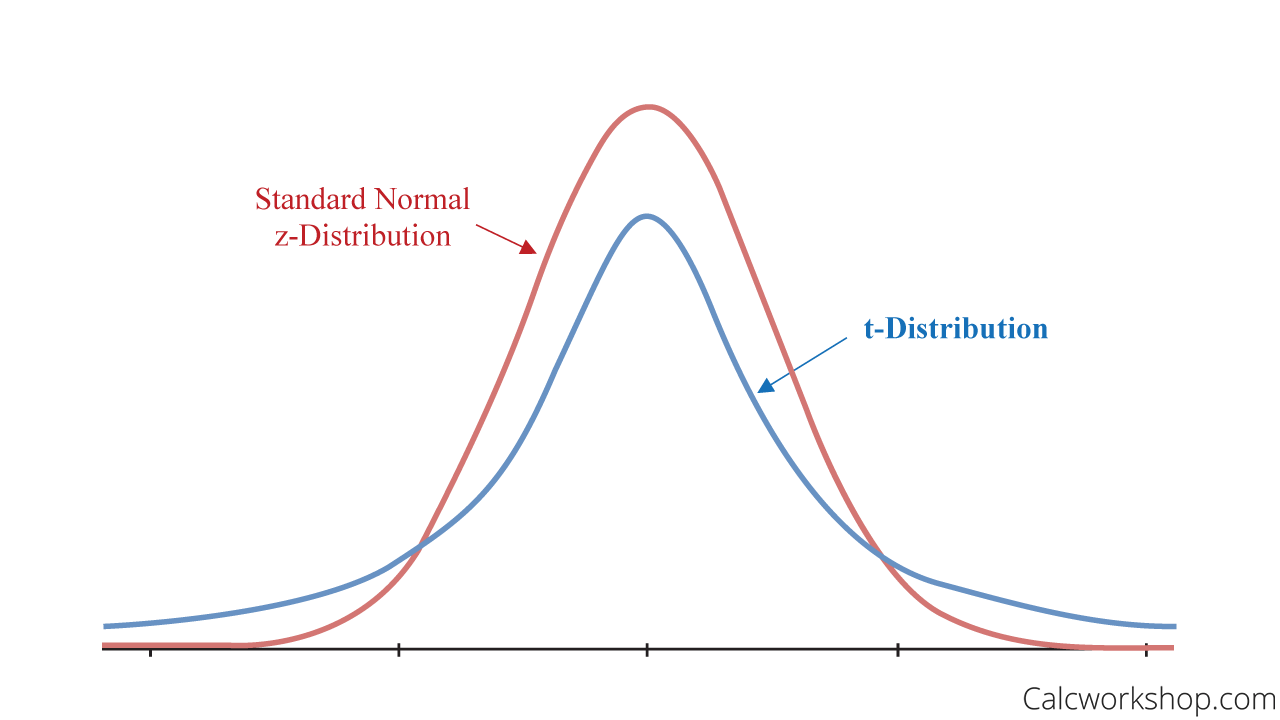
T Distribution vs Normal Distribution
Now, the t-distribution does come with an additional parameter, or a feature called degrees of freedom.
Degrees Of Freedom
What are the degrees of freedom?
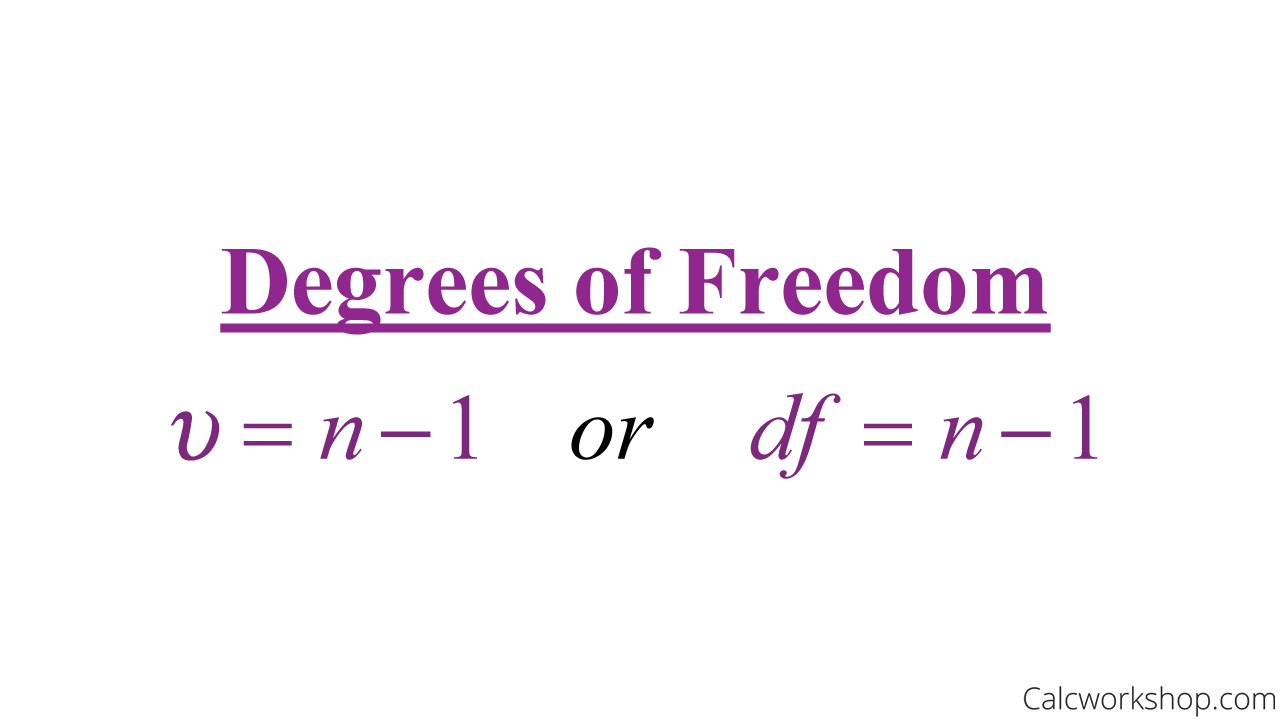
Degrees of Freedom Formula
Let me explain.
Imagine you’re hungry and your food options consist of three different pieces of fruit:
- Banana
- Apple
- Orange
You choose one, let’s say the banana, and eat it.
But you’re still hungry, so you go back and pick another fruit to eat.
But this time, you don’t have three fruit choices but only two (apple or orange).
So, you choose the apple and eat it. But again, you’re still hungry, so you go back to get more fruit.
Sadly, this time you don’t have any choice in what you pick, as there is only one piece of fruit left – orange.
That means you were only allowed to really “choose” which fruit you were going to eat for two out of the three selections because the last time you grabbed a piece of fruit, the choice was already made for you. So, your options were variable or free to vary (i.e., degrees of freedom) for two out of the three times.
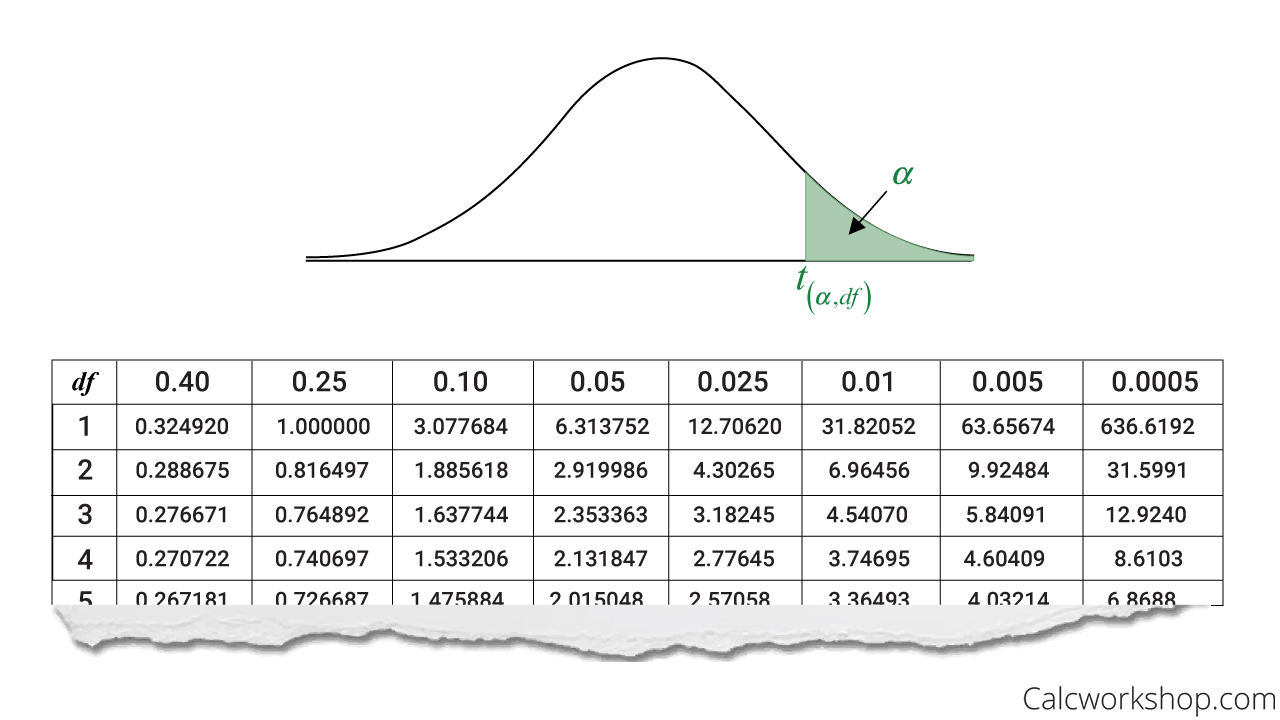
T-Distribution Table (One Tail)
Z-Table Vs. T-Table
It is also very important to note that a t-table behaves differently than a z-table.
A z-table provides you with the area to the left of the z-statistic. In contrast, a t-table gives you the area to the right of the t-statistic.
Additionally, we will also learn the difference between a one-tail (either upper tail or lower tail) test and a two-tailed test, as some t-tables will make a distinction between the two.
This will play an essential role in calculating our critical value and our test-statistic, so we will need to be careful in our analysis and pay close attention to the area we wish to calculate. We’ll elaborate more in the video below.
Confidence Interval For Population Mean
So how do we begin when finding a confidence interval for means?
First, we need to identify our point estimate, which is our sample mean (i.e., x-bar).
Then we need to calculate our standard error, which is the ratio of our sample standard deviation and the square root of our sample size.
Lastly, we need to find is our distribution critical value or t-star as it is sometimes called. This number represents the critical value of the t-distribution curve corresponding to a specified confidence level with corresponding degrees of freedom.
Now we are ready to construct a confidence interval for a population mean when the population standard deviation is unknown.
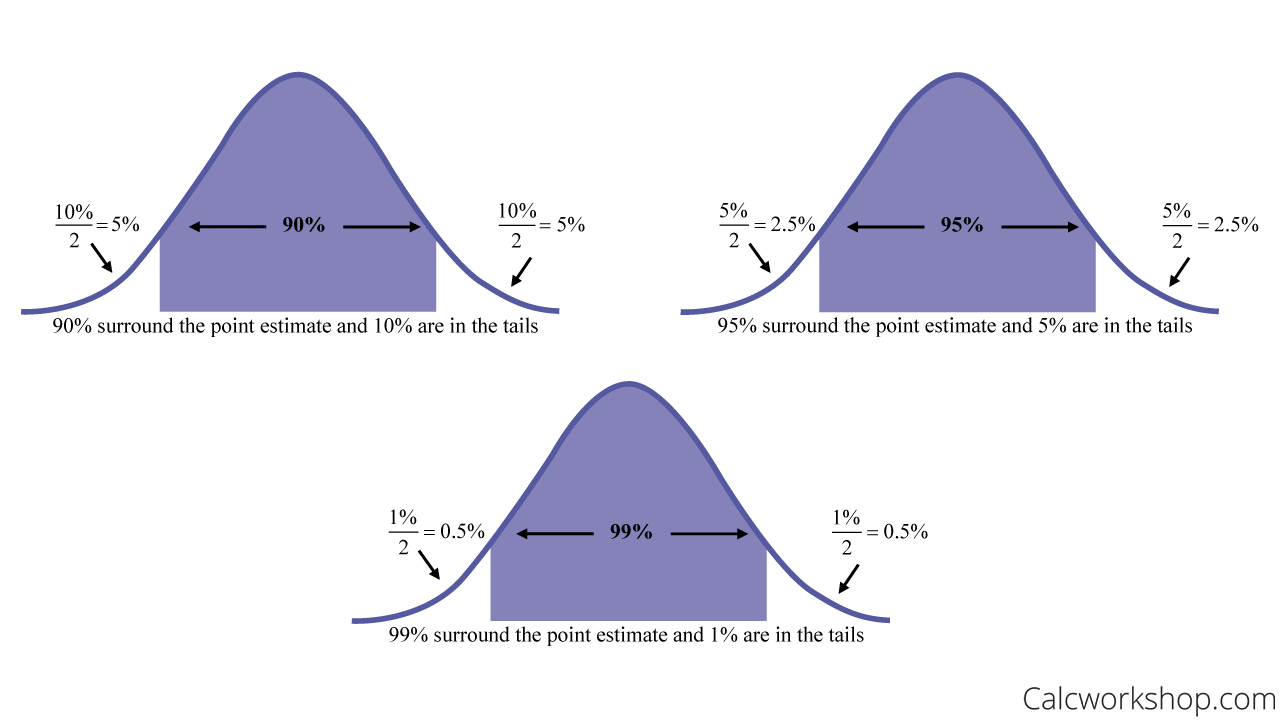
Remember, the most common confidence levels are as follows:
How To Interpret Confidence Intervals
And just like we saw with confidence intervals for population proportions, if you aren’t given a confidence interval, we always assume 95% confidence because it is considered a conservative estimation.
Worked Example
For example, let’s suppose a random sample of 41 students is taken at a local school where the mean grade point average (on a 4-point scale) was 3.21 with standard deviation 0.34, and we want to create a confidence interval for the average grade point average at the school.
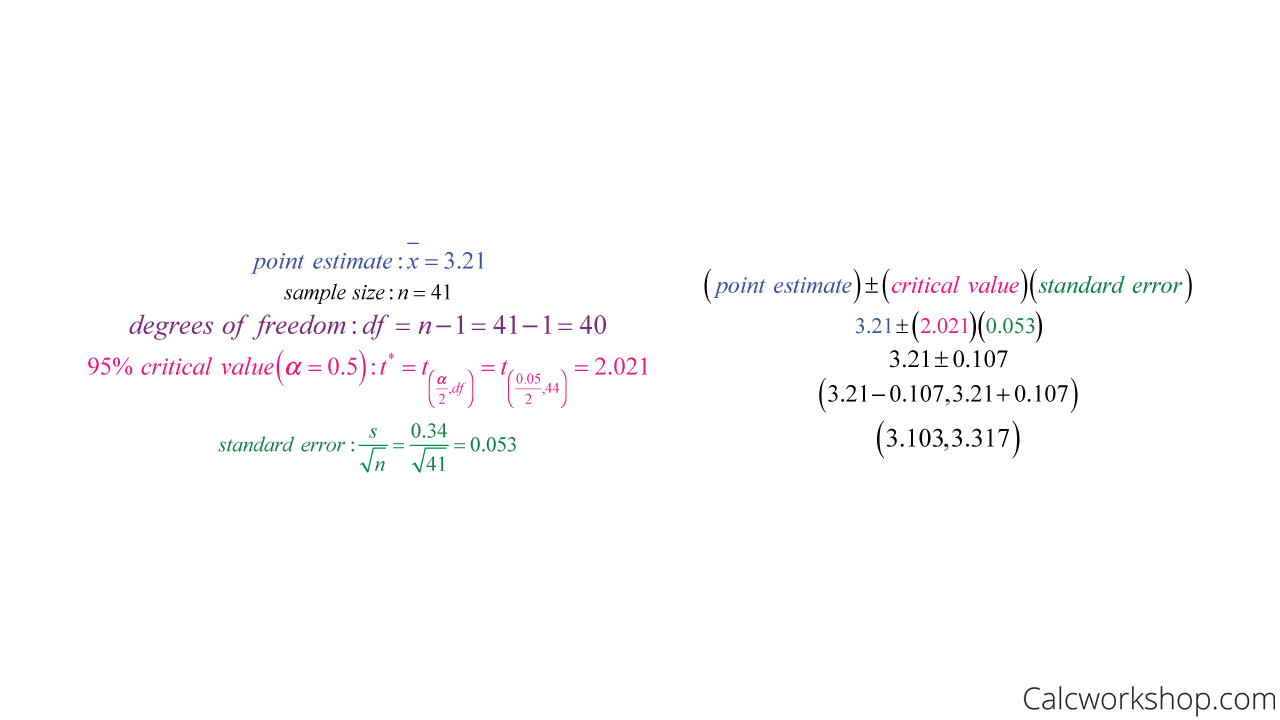
Construct a 95 Confidence Interval for the Population Mean
This means that we are 95% confident that the school’s actual grade point average is within the interval above.
Together we will also learn how to
- Choose an appropriate sample size for an estimation for a desired margin of error.
- Use our fantastic acronym for remembering how to construct confidence intervals.
- Use a t-table.
- Understand a t-distribution.
We walk through countless examples to help us master the technique of creating confidence intervals for the population mean.
Population Mean – Lesson & Examples (Video)
1 hr 8 min
- Introduction to Video: Confidence Intervals for Population Means
- 00:00:34 – How do we construct confidence intervals for means when population standard deviation is known (Examples #1-2)
- Exclusive Content for Members Only
- 00:18:06 – How to find the sample size for a known confidence level and margin of error (Examples #3-4)
- 00:26:42 – What is the t-distribution? What are degrees of freedom?
- 00:33:23 – How do you read a t-table to create a confidence interval with Example #5
- 00:44:58 – How to find the t-value for a confidence interval (Examples #6-8)
- 00:52:01 – Construct a confidence interval for means using t-table (Examples #9-10)
- 01:00:46 – Create a confidence interval for mean using data set and t-table (Example #11)
- Practice Problems with Step-by-Step Solutions
- Chapter Tests with Video Solutions
Get access to all the courses and over 450 HD videos with your subscription
Monthly and Yearly Plans Available
Still wondering if CalcWorkshop is right for you?
Take a Tour and find out how a membership can take the struggle out of learning math.